
Apr 18, 2019
Idle Green Threads in Hazelcast Jet
Hazelcast Jet is known for its high-performance and this is partially due to it employing green threads. This approach avoids the need for operating system threads, which are expensive to switch. Instead, task switching is performed by the application code in a lightweight way.
What are green threads?
With “normal” threads, you ask the OS to spin one for you and execute your code. The OS takes care of switching them, giving each of the threads a chance to do work for a while. The OS can interrupt the thread’s execution at any point, but saves its state and restores the state of another thread to resume its execution. This is called a context switch and it’s rather expensive in terms of CPU cycles.
With green threads, you have one OS thread for each CPU core that drives multiple green threads. In Jet, the driver is called a cooperative worker and switches between tasklets, which have to cooperate with the worker, hence the name. Tasklets are written in a specific way as they have only one operation (the call() method) and it must execute briefly and not block (*1). This is because the worker cannot interrupt the call() method, nor can it give a chance to another tasklet to execute while the current one is blocked. There’s no OS context switching involved.
The cooperative worker
The switching algorithm is fairly simple; this is a simplified version of it in Jet (full code here):
while (true) {
    boolean madeProgress = false;
    long idleCount = 0;
    for (Tasklet t : tasklets) {
        // let one tasklet do a piece of work
        madeProgress |= t.call();
    }
    if (madeProgress) {
        idleCount = 0;
    } else {
        idle(idleCount++);
    }
}
The worker repeatedly calls the tasklets’ call() method. The method returns whether the tasklet made any progress. In case of processors, it returns true when the processor took anything from the inbox or put anything to the outbox (and few more special cases).
The idle() call is a brief sleep in case none of the workers made progress. In Jet 3.0 it’s between 25 and 1000µs, depending on the idleCount (*2). As you probably can see now, if just one of the tasklets made progress, there won’t be any sleeping at all and we’ll proceed to the next iteration immediately. What this can cause is that even with pretty low traffic, the CPU usage will be quite high, especially if there are many tasklets per worker. For example, if you have many small jobs running in the cluster or if one has many vertices in the DAG (directed acyclic graph).
Take for example this job:
// The source generates Integer items at the desired rate. If rate
// is 1000, one Integer is generated every millisecond.
StreamSource<Integer> source = Sources.streamFromProcessor("src",
        ProcessorMetaSupplier.of(() -> new GeneratorP(rate)));
StreamStage<WindowResult<Long>> stage = p.drawFrom(source)
    .withIngestionTimestamps()
    // The following `map` stages do nothing, they are here only to
    // increase the cooperative tasklet count. (*3)
    .map(FunctionEx.identity())
    .map(FunctionEx.identity())
    .map(FunctionEx.identity())
    .map(FunctionEx.identity())
    .map(FunctionEx.identity())
    .map(FunctionEx.identity())
    .window(tumbling(1000))
    .aggregate(counting());
I’ve run this job with multiple item rates on a 1-member cluster and a pretty modest m5.large AWS instance. Here are the results:
| Rate/s | CPU usage[%] |
|---|---|
| 1k | 18 |
| 10k | 23 |
| 50k | 29 |
| 250k | 75 |
| 500k | 96 |
| 1m | 100 |
With just 1000 event/s, even though doing almost nothing with the events but moving them around, the CPU usage is close to 20%. At 1m items/s the CPU usage is 100% even though Jet still can push around 5m items/s on this machine.
To cope with this, in Jet 3.0 we introduced a property where you can increase the minimum sleeping time:
<hazelcast-jet xsi_schemaLocation="http://www.hazelcast.com/schema/jet-config hazelcast-jet-config-3.0.xsd"

        xmlns_xsi="http://www.w3.org/2001/XMLSchema-instance">
    <properties>
        <property name="jet.minimum.idle.microseconds">1000</property>
    </properties>
</hazelcast-jet>
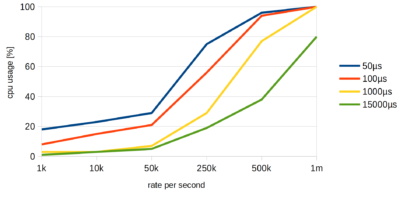
Here are the results with increased minimum sleep time:
Conclusion
As you can see, for 1000 items/s the CPU usage went down from 18% to 1%. For 250k items/s it went down from 75% to 19%.
The flipside of higher sleep times is that larger values cause higher internal latency, but it’s in the realm of milliseconds. That’s why Jet’s default is pretty low. Also, very high values limit the maximum throughput of the job. I cannot tell how much is a “very high value”: the throughput degrades, if upstream processor fills up the output queue buffer before the downstream processor wakes up. Do your own due diligence.
The job used in this test is also a worst case scenario where for this problem: if the 1k items came in bursts, the CPU overhead would be much smaller. But if you see high CPU usage for seemingly low traffic or if you want to save some electricity, you can experiment with this parameter.
(*1) Blocking can be due to I/O operations, waiting for synchronization or sleeping. Tasklets that can’t follow these rules are executed on a dedicated thread.
(*2) We use LockSupport.parkNanos() for sleeping and on Linux the actual sleeping time is by default rounded up to next 50µs. See a blog post by a colleague for more details.
(*3) Sequence of map stages is currently executed by a sequence of vertices in the DAG. In future we plan to fuse them, so the test code used here will not reproduce the issue so well.