Redis Load Handling vs Data Integrity: Tradeoffs in Distributed Data Store Design
Introduction
We all know that selecting the right technology for your business-critical systems is hard. You first have to decide what characteristics are most important to you, and then you need to identify the technologies that fit that profile. The problem is that you typically only get a superficial view of how technologies work, and thus end up making decisions on limited information.
Selecting amongst in-memory technologies – and especially distributed systems – can be especially challenging since many of the system’s attributes may not be easy to uncover. One topic, in particular, is how well a system protects you from data loss. All distributed systems use replication to try to reduce the risk of data loss due to hardware failure, but how the replication performs can vary by systems. The level of data safety you get is determined by the architectural design decisions built into the system. In this blog, we want to reinforce that design differences, including the nearly imperceptible ones, lead to materially different levels of data safety.
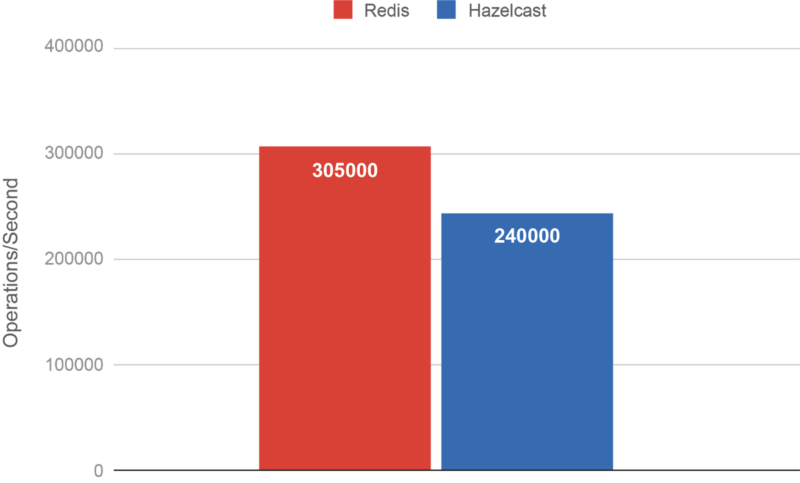
Recently, we were benchmarking Redis versus Hazelcast at high throughput to the point of network saturation. We were perplexed because Redis was reporting 50% higher throughput even though both systems were saturating the network using identical payloads. Network saturation should have been the limiting factor and with both systems writing to the primary and replica partitions, throughput should have been identical.
After much investigation, we learned that as workload grows, at some point Redis almost immediately stops replication and continues to skip replication while workload remained high. It was faster because Redis was writing only to the master, significantly raising the risk of lost data. This came as a big surprise to us and we suspect it will do the same for Redis users.
By default, Redis is sacrificing the safety of data to perform faster under high loads. Once the load finishes (or in this case the benchmark finishes) the replication is restarted and the replica shard re-syncs using the master RDB file, and everything appears to work normally. Hence, if you only verify consistency after the benchmark, the risky behavior will likely go unnoticed.
We expect that most users with busy systems are silently experiencing this scenario, unbeknownst to them as it takes a master node failure when under load to show it up as data loss.
This means two critical things:
- Redis can look great in a benchmark, but
- Redis will lose data if a master shard is lost when the workload is high enough that the “partial sync” stops.
In this blog, we will explore, in detail, the mystery of Redis data loss under load.
Watch the Movie
Here we show, with first Redis and then Hazelcast, populating a cache under load and then killing the master node. Redis loses data; Hazelcast doesn’t.
The Mystery
Testing Hazelcast vs Redis at scale, we found that Redis was reporting 305,000 operations per second whereas Hazelcast reported 240,000. The entry value size was 110KB and both systems were configured for 1 replica.

The peculiar thing was that we were both saturating a 50Gbps network.
The Redis Benchmark Does Not Compute
We started turning over different rocks to see if we could find the root cause of the difference.
Data Compression
Could Redis possibly be using data compression causing smaller network payloads that could lead to better performance overall?
We closely monitored Redis’ communication between members and clients with networking capturing tools to make sure there was no compression on the payloads exchanged between endpoints. We identified no compression on the communication links, apart from the RDB files, which was a documented feature, which we anticipated. This, of course, explains nothing toward our benchmark figures.
Network Bandwidth
Is the available bandwidth on the boxes enough to sustain the load we are generating? 50Gbps translates to roughly 6.25GB / sec, but the actual throughput can be affected by the number of flows, between endpoints and/or cloud quotas on them.
Profiling
Last but not least, we needed to profile Hazelcast members, ideally, with Java Flight Recorder to capture as much data as possible, that could help in pinpointing the exact root of our slower benchmark result.
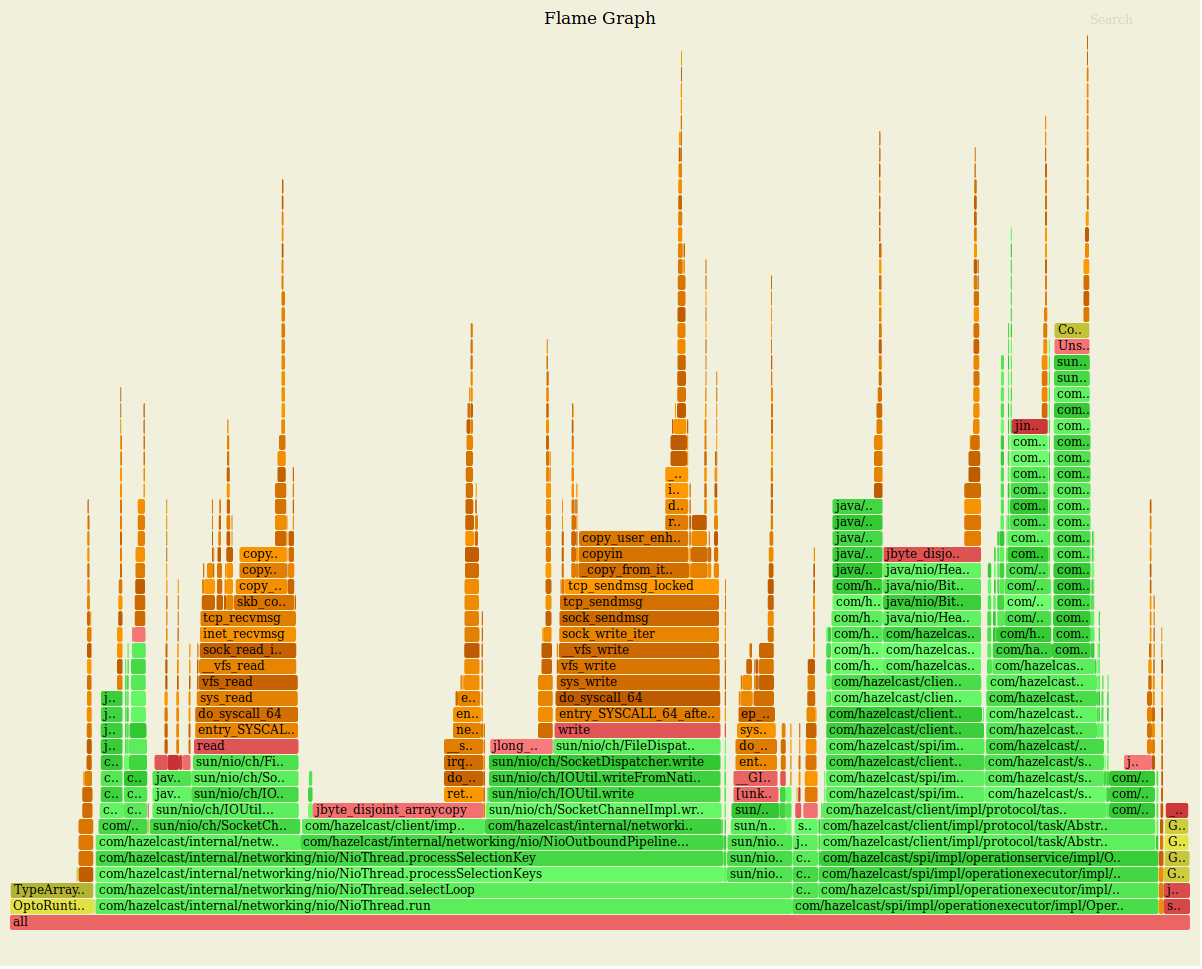
All JFR recordings and `prof` analysis on the members and clients show no significant hotspots that would justify the difference. We could reason about most of the output.
Network Utilisation
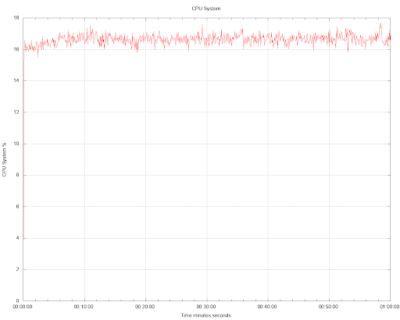
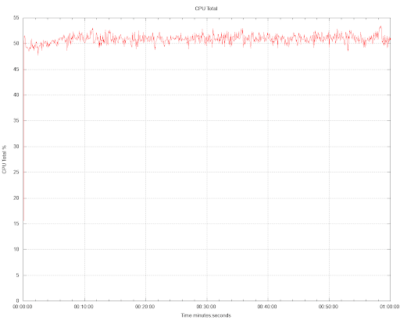
While inspecting the network load on the boxes, during a test run we did notice that both benchmarks reported the same network utilization.
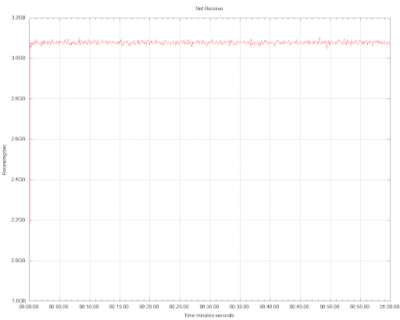
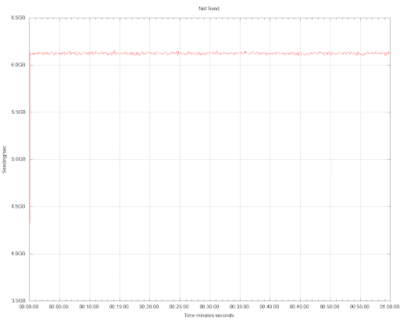
In both cases, the outbound link was saturated, almost at 50Gbps at all times. We know for certain that the reported throughput of both systems is different, nevertheless, the reported network utilization is the same.
Both systems were able to saturate the network, the payloads were the same, so how could throughput be different?
So some more theories?
- Either Hazelcast is spending more of the bandwidth for other network interactions, that we obviously didn’t consider, or…
- Redis is doing something less than we believed it was doing.
A Closer Look at Redis
At Hazelcast we use a tool called Simulator, which is used for performance and soak testing Hazelcast and other systems. The Simulator output, demonstrating the actual throughput of the Redis cluster during the benchmark was:

All system statistics read healthy, from every point-of-view. CPU, I/O, Memory, all well within healthy ranges and similar from host to host.
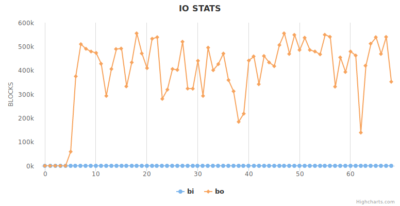
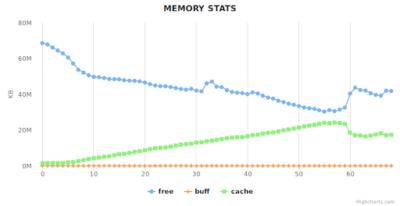
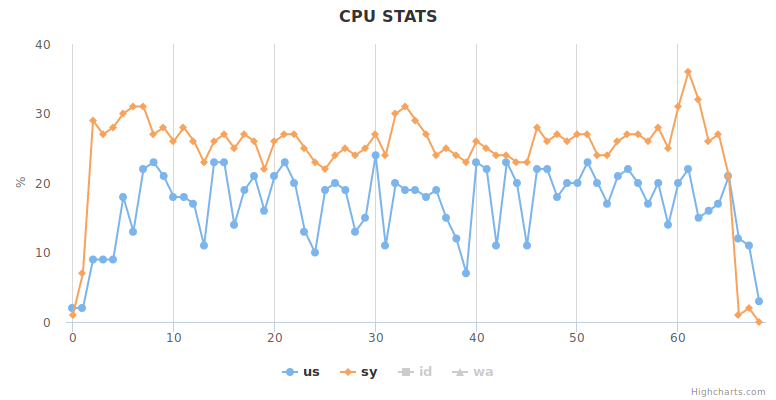
However, on detailed, process per-process CPU utilization, we noticed that the Redis replica shards were utilizing 0% of the core. Which means they are not doing any work which can only be that there were not getting any data. This is the smoking gun.
Having a closer look at the logs, we notice the following output:
Master logs
3403:M 02 Jul 2019 11:57:15.114 – Accepted 10.0.3.246:56918
3403:M 02 Jul 2019 11:57:15.538 # Client id=549 addr=10.0.3.145:50480 fd=670 name= age=2 idle=2 flags=S db=0 sub=0 psub=0 multi=-1 qbuf=0 qbuf-free=0 obl=62 oll=2447 omem=268494184 events=r cmd=psync scheduled to be closed ASAP for overcoming of output buffer limits.
3403:M 02 Jul 2019 11:57:15.595 # Connection with replica 10.0.3.145:7016 lost.
Replica logs
3332:S 02 Jul 2019 11:57:13.538 * Connecting to MASTER 10.0.3.17:7000
3332:S 02 Jul 2019 11:57:13.539 * MASTER <-> REPLICA sync started
3332:S 02 Jul 2019 11:57:13.539 * Non blocking connect for SYNC fired the event.
3332:S 02 Jul 2019 11:57:13.539 * Master replied to PING, replication can continue…
3332:S 02 Jul 2019 11:57:13.539 * Partial resynchronization not possible (no cached master)
3332:S 02 Jul 2019 11:57:13.557 * Full resync from master: 41416b4cb4c33baa6a7a32b360cc58e9c767f144:4164722921
3332:S 02 Jul 2019 11:57:38.672 # I/O error reading bulk count from MASTER: Resource temporarily unavailable
At this stage, we start suspecting that there is no replication going on.
Which is confirmed by running the ‘INFO’ command on redis-cli, which reports:
master_link_status: down
Mystery Solved
Redis is turning off copying to the replica and can thus use all of the network bandwidth to write to the master only.
Consequences: Data Loss
No ongoing replication under system load means that the data is not safe in the event of a master node failure. If we don’t actively replicate the entries and the host goes down or a network partition takes place, all entries not written to the replica are lost.
In-Depth Analysis of Redis Logs, Code and Documentation
Investigating the logs and the code, it seems that the reason we hit this issue is a combination of the rate of events alongside the size of the entries. The following log message points to the ‘client-output-buffer-limit’ setting, which by default for replicas is set to 256MB hard limit, or 64MB soft limit:
Client id=549 addr=10.0.3.145:50480 fd=670 name= age=2 idle=2 flags=S db=0 sub=0 psub=0 multi=-1 qbuf=0 qbuf-free=0 obl=62 oll=2447 omem=268494184 events=r cmd=psync scheduled to be closed ASAP for overcoming of output buffer limits.
According to the documentation:
# The client output buffer limits can be used to force disconnection of clients

# that are not reading data from the server fast enough for some reason (a

# common reason is that a Pub/Sub client can't consume messages as fast as the

# publisher can produce them).

#

# The limit can be set differently for the three different classes of clients:

#

# normal -> normal clients including MONITOR clients

# replica  -> replica clients

# pubsub -> clients subscribed to at least one pubsub channel or pattern

#

# The syntax of every client-output-buffer-limit directive is the following:

#

# client-output-buffer-limit <class> <hard limit> <soft limit> <soft seconds>

#

# A client is immediately disconnected once the hard limit is reached, or if

# the soft limit is reached and remains reached for the specified number of

# seconds (continuously).

# So for instance if the hard limit is 32 megabytes and the soft limit is

# 16 megabytes / 10 seconds, the client will get disconnected immediately

# if the size of the output buffers reach 32 megabytes, but will also get

# disconnected if the client reaches 16 megabytes and continuously overcomes

# the limit for 10 seconds.

#

# By default normal clients are not limited because they don't receive data

# without asking (in a push way), but just after a request, so only

# asynchronous clients may create a scenario where data is requested faster

# than it can read.

#

# Instead there is a default limit for pubsub and replica clients, since

# subscribers and replicas receive data in a push fashion.

#

# Both the hard or the soft limit can be disabled by setting them to zero.

client-output-buffer-limit normal 0 0 0

client-output-buffer-limit replica 256mb 64mb 60

client-output-buffer-limit pubsub 32mb 8mb 60
This state of things forces the replication link to go down, and once this happens Redis gets into an endless loop of:
- Attempting connection with Primary
- Connection succeeded
- Attempting partial sync with X offset
- Partial sync fails due to lack of backlog
- Attempting FULL sync
- Full sync fails due to I/O timeout (see. repl-timeout)
- Connection closes
This happens for the duration of the benchmark. Once load eases out, the full sync is able to complete, successfully bringing the two shards up to date.
The most important part of this finding is that Redis offers no feedback loop. There is no way for a client/producer to be aware of this situation, thus, exposing users to potential data loss, while from a developer’s perspective, everything is behaving.
The only feedback offered is through careful reading of the logs and the CLI INFO command. With data durability at risk, one would expect that Redis would either back-pressure the producers or inform them by rejecting new writes. However, it appears that replicas are treated similarly to any other form of client.
Forcing Redis to Not Lose Data Under Load
We decided to see if there was a way to configure Redis to not lose data under load. There are a few things in the configuration that seem to help prevent this state of things between primary and replica nodes.
Client Output Buffer
The setting which seems to be the most relevant to data loss is:
client-output-buffer-limit replica 256mb 64mb 60s
According to the documentation, this acts as a protection against slow clients, however, in our case the clients are the replica nodes themselves. Since we pushed so much traffic through Redis, the replicas weren’t able to consume it as fast, creating an accumulation of data in the output buffer of the shard. This limit is adjustable, and ideally, it should prevent the disconnection from happening.
The default settings are limiting the buffer to a max of 256mb, hard limit (per shard). That means that for 16 primary shards, the buffers can grow up-to 4GB on that single host. This is not bad, but if we want to tune this to allow for longer connectivity for replication, then a value of 1GB could, in the worst case, occupy 16GB of memory in that single host. This value only accounts for the single replica connection buffer, not the live data set, nor any other buffers used in the process.
In other words, we need to accommodate for such a choice during planning/sizing but that is an impractically high amount to set for an output buffer.
Replication Backlog Size
Another setting is the ‘repl-backlog-size’ which by default is 1mb. According to the documentation:
# Set the replication backlog size. The backlog is a buffer that accumulates

# replica data when replicas are disconnected for some time, so that when a replica

# wants to reconnect again, often a full resync is not needed, but a partial

# resync is enough, just passing the portion of data the replica missed while

# disconnected.

#

# The bigger the replication backlog, the longer the time the replica can be

# disconnected and later be able to perform a partial resynchronization.

#

# The backlog is only allocated once there is at least a replica connected.
That has nothing to do with the replication link going offline in the first place, but nevertheless, it does tell us that with a well-sized backlog we should be able to survive temporary network downtimes between the nodes.
This ‘well-sized’ part is a nightmare of course for dev-ops because it requires planning and understanding of the application needs in storage; which, if changed, will need to be readjusted. In our case, we were storing payloads of 110KB, which are on the heavy side of the scale. Choosing a big backlog, in our case, an optimized setting of 1GB instead of 1MB means that we have storage for ~100 requests per shard on that box at the expense of 1GB of memory utilization per shard (on that box).
In other words, it’s also quite expensive in storage and offers a small time-window at this payload size for the partial sync to be used. However, under this kind of load, if you want to avoid the bandwidth cost of a FULL replication, and you want your replicas to be up-to-date sooner, then it should be adjusted.
Getting Feedback – Min Replica
Within Redis replication configuration, Redis contains a ‘min-replicas-to-write’. It is a way to force Redis to provide some feedback to the caller that things went wrong – i.e. being unable to replicate.
From the configuration:
# It is possible for a master to stop accepting writes if there are less than

# N replicas connected, having a lag less or equal than M seconds.

#

# The N replicas need to be in "online" state.

#

# The lag in seconds, that must be <= the specified value, is calculated from

# the last ping received from the replica, that is usually sent every second.

#

# This option does not GUARANTEE that N replicas will accept the write, but

# will limit the window of exposure for lost writes in case not enough replicas

# are available, to the specified number of seconds.

#

# For example to require at least 3 replicas with a lag <= 10 seconds use:

#

# min-replicas-to-write 3

# min-replicas-max-lag 10

#

# Setting one or the other to 0 disables the feature.

#

# By default min-replicas-to-write is set to 0 (feature disabled) and

# min-replicas-max-lag is set to 10.
To explain this better, if during a write a replica is OFFLINE or not responding to HB for more than X (lag setting) seconds, the write will be rejected. On the client-side you get an appropriate response, which most Java clients (in our case Jedis) handle with an exception.
redis.clients.jedis.exceptions.JedisDataException: NOREPLICAS Not enough good replicas to write.
This doesn’t fix the data loss problem, but it does provide a way to get feedback to the caller that the replicas are behind and data loss is possible.
Moreover, this is not on by default. By default, the number of required replicas is 0. Meaning you will not get notified.
Forced Sync with WAIT Operation
Full sync is another solution and probably the best to guarantee the safety of your data. However, it comes with a cost, the cost of issuing one more command (ie. ‘WAIT’) per operation, or even periodically. What this does is to guarantee that all replicas are up-to-date when it completes.
This extra command makes your application logic slightly more complicated; you now have to control how often to send this command and in rare and unfortunate timings it could lead to global pause of the application for X seconds while all writes are issuing the same command at the same time.
Issuing WAIT will dramatically slow down the throughput of Redis.
While it is part of the Redis command set, it is not implemented in all the clients. For Java developers, neither of the two Java clients from Jedis and Lettuce support the ‘WAIT’ command. So this is not possible to do from Java.
Throttling
Last but not least, and the only solution we were able to use and rely on to achieve replication of our data was to externally control the throttle of the requests. For the benchmark, it means that we set Simulator to latency mode, which has a rate limiter that is pre-configured and ensures that no more requests are issued in a given period of time.
Interestingly, using this approach we were able to get our Redis test cluster up to 220,000 ops/second, which was 20,000 ops/second less than Hazelcast. Any rate above this triggered a loss of writes to the replica and potential data loss.
In benchmarks, it’s quite trivial to implement such a limiter because we rely on a static figure for the rate, per client. In real-world applications, we don’t have constant requests equally from all clients.
That means that we need a distributed rate limiter that distributes a global capacity in slots to all clients, according to the load and needs of each one respectively. Quite a hassle.
Therefore, it is impractical to utilize throttling in an application.
How to Reproduce
Reproducer 1
For this reproducer, all you need is Java and a laptop. It uses a 2 node cluster of Redis and of Hazelcast running locally on the laptop.
It uses the code shown in the video.
Redis reproducer showing data loss: https://github.com/alparslanavci/redis-lost-mydata
The same test running against Hazelcast with no data loss:
https://github.com/alparslanavci/hazelcast-saved-mydata
Reproducer 2
This reproducer uses the detailed Simulator code outlined in the benchmarking exercise that discovered this problem. This one is pretty involved to set up for anyone outside of Hazelcast Engineering, but included here for transparency completeness.
Hardware Environment
| Host type |
EC2 type c5n.9xlarge |
| vCPU |
36 |
| RAM |
96GiB |
| Network |
50Gbps |
| Number of member instances |
4 |
| Number of client instances |
25 |
* Notice the number of client instances needed to generate enough load and bring the software to its absolute limits. More on that in the future.
Software Environment
| Configuration |
Hazelcast |
Redis |
| Clients |
100 (4 on each host) |
|
| Client type |
JAVA |
Jedis |
| JVM settings |
G1GC |
|
| Number of threads / client |
32 |
|
| Entry In-memory format |
HD (72GB) |
N/A |
| Replica Count |
1 |
|
| Replication Type |
Async |
|
| IO Threads |
36 |
N/A |
| Shards |
N/A |
32 primary / host |
| Nearcache |
20 %
|
– |
The benchmark was done using the stress test suite by Hazelcast and Simulator (https://github.com/hazelcast/hazelcast-simulator) which provides support for both Hazelcast and Jedis drivers.
Test Case
| Number of maps |
1 |
| Entry Count |
450,000 |
| Payload size |
110KB (random bytes) |
| Read/Write Ratio |
3 / 1 (75% / 25%) |
| Duration |
1 hour |
Source code for the test is available here: ByteByteMapTest
How to Run
Starting the benchmark
- Clone benchmark repo redis-nobackups
- Install Hazelcast Simulator locally (https://github.com/hazelcast/hazelcast-simulator#installing-simulator)
- Launch 29 EC2 instances as described under Hardware Environment
- Tag the instances with the same placement
- Make sure you use ENA supported AMIs to avail for the high bandwidth links between nodes in the same placement.
- CD in the benchmark directory
- Collect private and public IPs of the EC2 instances, and update the agents.txt or redis_agents.txt file for Hazelcast or Redis, respectively.
- Run `provisioner –install`
- SSH to the first 4 instances, and install Redis
For Redis
- Start 32 shards per instance on the first 4 instances
- Once the shards are started, form the cluster with 1 replica using the command below:
- redis-cli –cluster create <IP:host addresses of all shards separated by space> –cluster-replicas 1
- Wait until cluster is formed observing message:
- [OK] All nodes agree about slots configuration.
- >>> Check for open slots…
- >>> Check slots coverage…
- [OK] All 16384 slots covered.
- Run `./run-jedis.sh`
For Hazelcast
- Run `./run-hazelcast.sh`
Showing Data Loss
Wait until the throughput stabilizes to its max, which is usually the best indicator that replication is no longer occurring.
Verify link status between the primary and replicas:
- Connect to one of the primary shards using redis-cli
-
redis-cli -h <hostname> -p <port> "info"
Looking for the following indicator in the output:
Master_link_status:down
-
- Once verified, kill the processes from the box (simulate networking issues or dead member).
-
- Run `killall -9 redis` to stop all Redis processes
- Stop the benchmark
- Wait until failover is complete
- Assert number of total insertions (benchmark report) versus number of entries in the cluster
- A single box can host multiple shard processes and effectively all of them will experience the same issue with replicas. The data loss is not limited to a single shard (process). It’s more likely that a node (physical or virtual) will go offline or crash than a single process crashes.
- Getting the DBSIZE of all primary shards in the cluster and comparing it to the number of puts from the simulator. In our case, 2,779,336 entries were inserted, but we only measured 2,209,922 at the end of the test.
The gap between what was inserted and what is measured at the end is heavily affected by the time difference between killing the processes and stopping the benchmark. The longer the benchmark is running after processes are down, the bigger the difference. Also note that if you wait too long to check, Redis will have performed a full sync.
Conclusion
Given Redis’ design decisions around dropping replicas under load, there are two major implications: firstly for Redis users and secondly for those comparing benchmarks between Redis and other systems which do properly replicate data.
Implications for Redis Users
If Redis users thought that setting up replicas meant they had data redundancy and multiple failures were required to lose data, they were wrong. A single point of failure on the master node is enough to potentially lose data.
Redis can also be configured to read from replicas. Users probably expect that replicas are eventually consistent with low inconsistency windows. Our testing shows that that inconsistency can live on for hours or days if high load continues.
As we showed above, there is currently no practical way covering all scenarios to stop Redis from falling behind on replicas. It is possible to carefully configure large amounts, possibly up to tens of GBs as in our case, of Client Output Buffers and Replication Queues for a given application, but this would require further testing to gain assurance.
Implications for Hazelcast vs Redis Benchmarking
Hazelcast is very fast. We know that, which is why we refused to accept that Redis was outperforming us on an at-scale test. We think it is critical that users understand that benchmarks should be apples to apples and that a configured data safety level be the actual level you are getting.
This goes for Redis benchmarking against other systems and also the headline performance numbers that Redis Labs put out.
Once we rate-limited Redis and then took it to the maximum without data loss, Hazelcast still beat it… without the risk of data loss due to a failed replication.
