
By Fawaz Ghali
Director of Developer Experience
Fawaz Ghali is the Director of Developer Experience at Hazelcast with more than 22 years of experience in DevRel, cloud, enterprise software development and deployment, ML/AI and real-time intelligent applications, management and leadership. He holds a PhD in Computer Science and has worked in the private sector as well as academia and research. He has published over 45 scientific peer-reviewed papers in the fields of ML/AI, data science and cloud computing on Google Scholar. Fawaz is a renowned expert with 200+ talks and presentations at global events and conferences.
View all blogs by the authorOct 31, 2022
How to Bootstrap a Hazelcast Cluster in Kubernetes
In this blog post, we are happy to work with our community member, Vishesh Ruparelia, a software engineer at one of the leading companies in the observability space. He has completed his computer science post-graduation from the International Institute of Information Technology, Bangalore, India, and is intrigued by the technical nitty gritties of designing any distributed platform. Additionally, he is fascinated by the impact of minor technical design decisions on a platform’s ability to scale. Having learned much from the open-source community, Vishesh is always looking for opportunities to give back.
Introduction
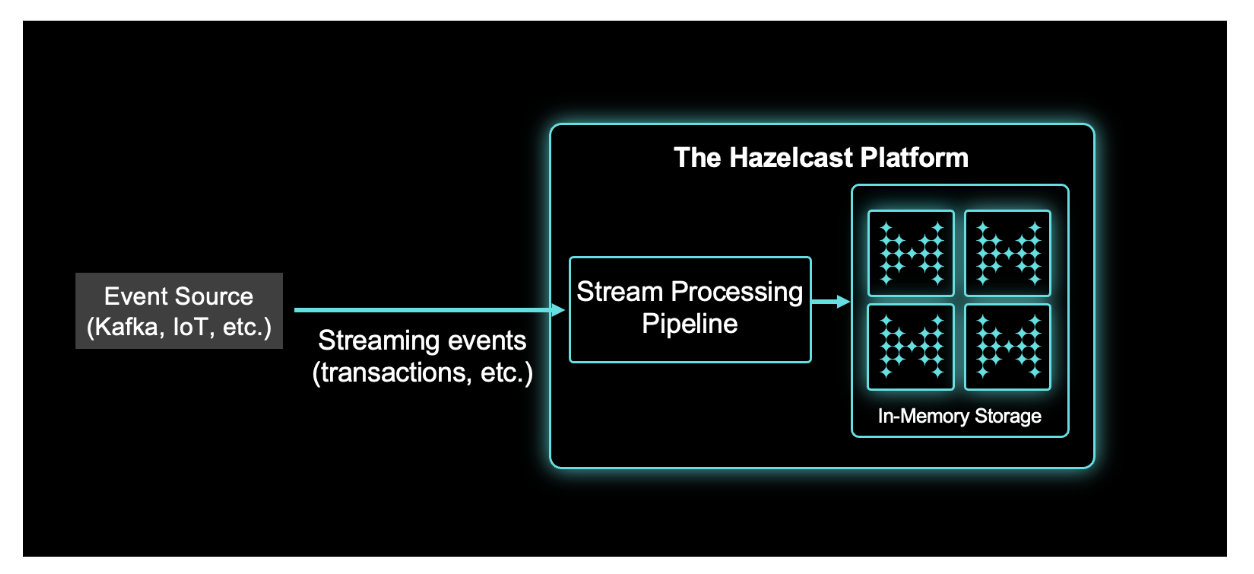
This article aims to help Hazelcast users to bootstrap a Hazelcast cluster in a Kubernetes-enabled environment. At the end of this article, you will be able to deploy and manage Hazelcast clusters, write stateless streaming jobs (using Hazelcast’s stream processing engine), and submit and manage them in the cluster. You will also get an idea of how to integrate your Hazelcast pipeline with Kafka. As a reference, we will submit a simple job that, given a sentence as input, emits the number of words in that sentence.
We are looking forward to your feedback and comments about this blog post. Don’t hesitate to share your experience with us in our community Slack or Github repository.
Prerequisite
Before we dig deep, the article assumes that the reader has the following set of prerequisites covered:
- Basic knowledge of Kubernetes and access to a Kubernetes cluster.
- Download the latest Hazelcast binaries from here: https://hazelcast.com/open-source-projects/downloads/
- Install helm: https://helm.sh/docs/intro/install/
- Note: Helm binaries should be available on the PATH.
- Clone the reference repository: https://github.com/visheshruparelia/hazelcast-word-count-demo
- This repo contains the code referenced by the article.
Setting up the environment
Deploying Hazelcast cluster
We will be using the Helm package manager to deploy the Hazelcast cluster. Helm is an open-source package manager for Kubernetes and provides the ability to deliver, share, and use software built for Kubernetes [1].
The helm chart we will use is a part of the reference code and is located at /helm in the root of the repository. The chart is based on the official helm chart provided by Hazelcast here: https://github.com/hazelcast/charts; the only change is that we have a name override in place.
Run the following commands to deploy the cluster successfully:
- cd into the root of the repository.
- Run:
helm install word-count -f ./helm/charts/word-count/values.yaml ./helm/charts/word-count
When you run:
kubectl get pods You should see the following output:

Deploying Kafka
We will be using Kafka to feed data to the Hazelcast cluster. If you already have Kafka brokers and Zookeeper running in the environment, you can skip this step.
To set up Kafka in the environment, we will use the Bitnami managed Kafka docker images. Follow the following commands to install:
- cd into the root of the repository.
- Run:
helm install kafka -f kafka.yaml bitnami/kafka(kafka.yaml contains the overrides that the docker image will use.)
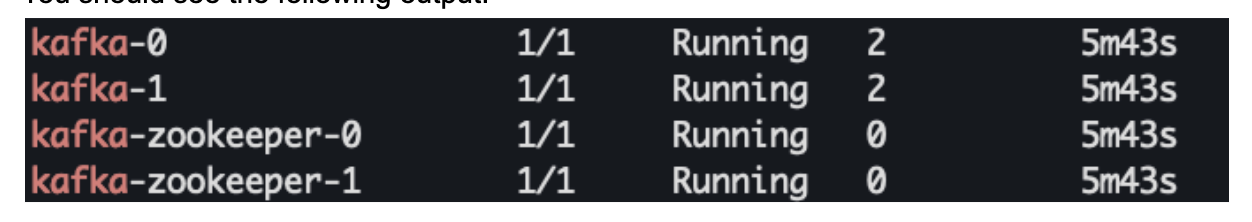
By default, when you run:
kubectl get pods You should see the following output:
Deploying Data Producer
We need to deploy a Kafka producer who pushes data to the Kafka topic so that Hazelcast can consume it. The reference repository contains the data production code and the Dockerfile which can be used to deploy the producer in our environment.
Follow the following commands to deploy:
- cd into the root of the repository.
- Run:
kubectl apply -f sentence-producer.yaml
By default, when you run:
kubectl get pods

Running a job
We will use Hazelcast as our streaming engine and submit a job to it. Hazelcast is a distributed batch and stream processing system that can do stateless/stateful computations over massive amounts of data with consistent low latency.
Writing a job
Hazelcast allows us to submit jobs by creating an Object of type Pipeline (we can also create a DAG object that is not in the scope; to read more, visit this link). A pipeline contains the logic of how to read, process, and emit data. The general shape of any pipeline is readFromSource -> transform -> writeToSink and the natural way to build it is from source to sink. In each step, such as readFrom or writeTo, you create a pipeline stage. The stage resulting from a writeTo operation is called a sink stage and you can’t attach more stages to it. All others are called compute stages and expect you to connect further stages to them. Detailed documentation is available here.
Hazelcast has many connectors out of the box to connect different (data) sources and sinks. The extensive list can be found here. On top of this, Hazelcast also enables users to write their custom connectors if the data source/sink required is not supported out of the box – more details here. This article will use Kafka as a source and Logger as our sink.
You can find the code that creates this Pipeline in the reference repository.
Submitting a Job
The pipeline, when running inside a cluster, is called a Job. Two ways are using which we can submit a Pipeline to the cluster: Using the CLI and Programmatically.
Using the CLI
We can use the Hazelcast binaries to submit the job using CLI. The CLI allows us to pass on a Jar as an argument and contains the code to build and submit the pipeline. The pipeline may have some dependencies which are not present in the cluster. Thus this Jar should also include the dependent libraries without which the Job cannot run. These dependent classes will be made available in the classpath of the cluster—basically an Uber Jar.
I used this plugin in the reference code to create a shadowed jar. The shadowed Jar is created as a part of the build step itself and is stored at the location: app/build/libs/app-all.jar. Follow the following steps to submit the pipeline:
- cd into the root of the repository.
- Run:
./gradlew clean build -x test
This creates the shadowed Jar. - cd into the Hazelcast folder (which contains the binaries) downloaded as a part of the prerequisites.
Paste the following config in the config folder inside the Hazelcast folder. Name the file hz.yaml
hazelcast-client:

cluster-name: word-count

network:

cluster-members:

- 127.0.0.1:5701

smart-routing: false

connection-strategy:

connection-retry:

# how long the client should keep trying connecting to the server

cluster-connect-timeout-millis: 1000
This file contains the cluster connection information binaries will use to connect to the cluster. A list of all possible configurations can be viewed here.
- Run:
kubectl port-forward svc/word-count 5701:5701 - Run:
kubectl port-forward svc/word-count-mancenter 8080
Run:
bin/hz-cli --config config/hz.yaml submit --class=com. PATH_TO_REFERENCE_REPO/app/build/libs/app-all.jar
–class flag indicates the entrypoint where the logic of Job submission resides.
–config flag indicates the config file to be used to establish connection with the cluster.
- For cluster size <= 3, you can view the job execution details on localhost:8080
Programmatically
Instead of submitting a Jar, we can directly submit the job to the cluster using Java code. The sample code which achieves this can be found here.
Run the following commands:
kubectl port-forward svc/word-count 5701:5701kubectl port-forward svc/word-count-mancenter 8080./gradlew clean build -x testjava -cp PATH_TO_REFERENCE_REPO/app/build/libs/app-all.jar hazelcast.word.count.App
Verification
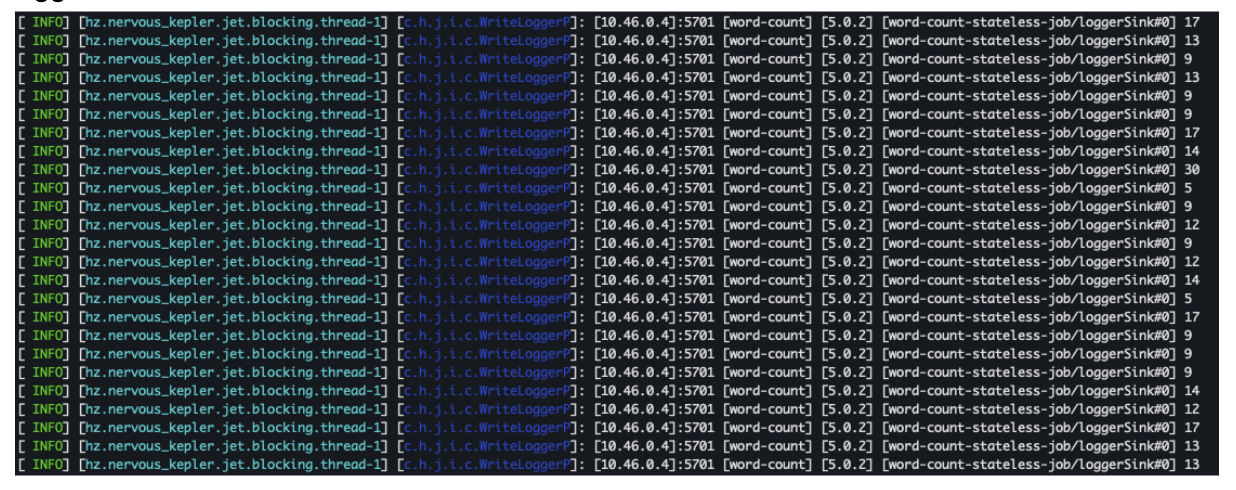
Once the job runs in the cluster, one of the ways to confirm is by looking at the cluster logs. Run kubectl logs word–count-0 -f to get the log output. As we saw earlier, the pipeline is writing the output to a LoggerSink; we can see the count of words being logged below:
Viewing job metrics
Using MC
Now that the job is running, we can use Hazelcast Management Center to get an insight into the cluster. Hazelcast Management Center enables the monitoring and management of nodes running Hazelcast. This includes monitoring the overall state of clusters, detailed analysis and browsing of data structures in real-time, updating map configurations, and taking thread dump from nodes [2].
By default, the Hazelcast helm chart also deploys Management Center. We need to port forward the management center’s service to access the UI. Run:
kubectl port-forward svc/word-count-mancenter 8080
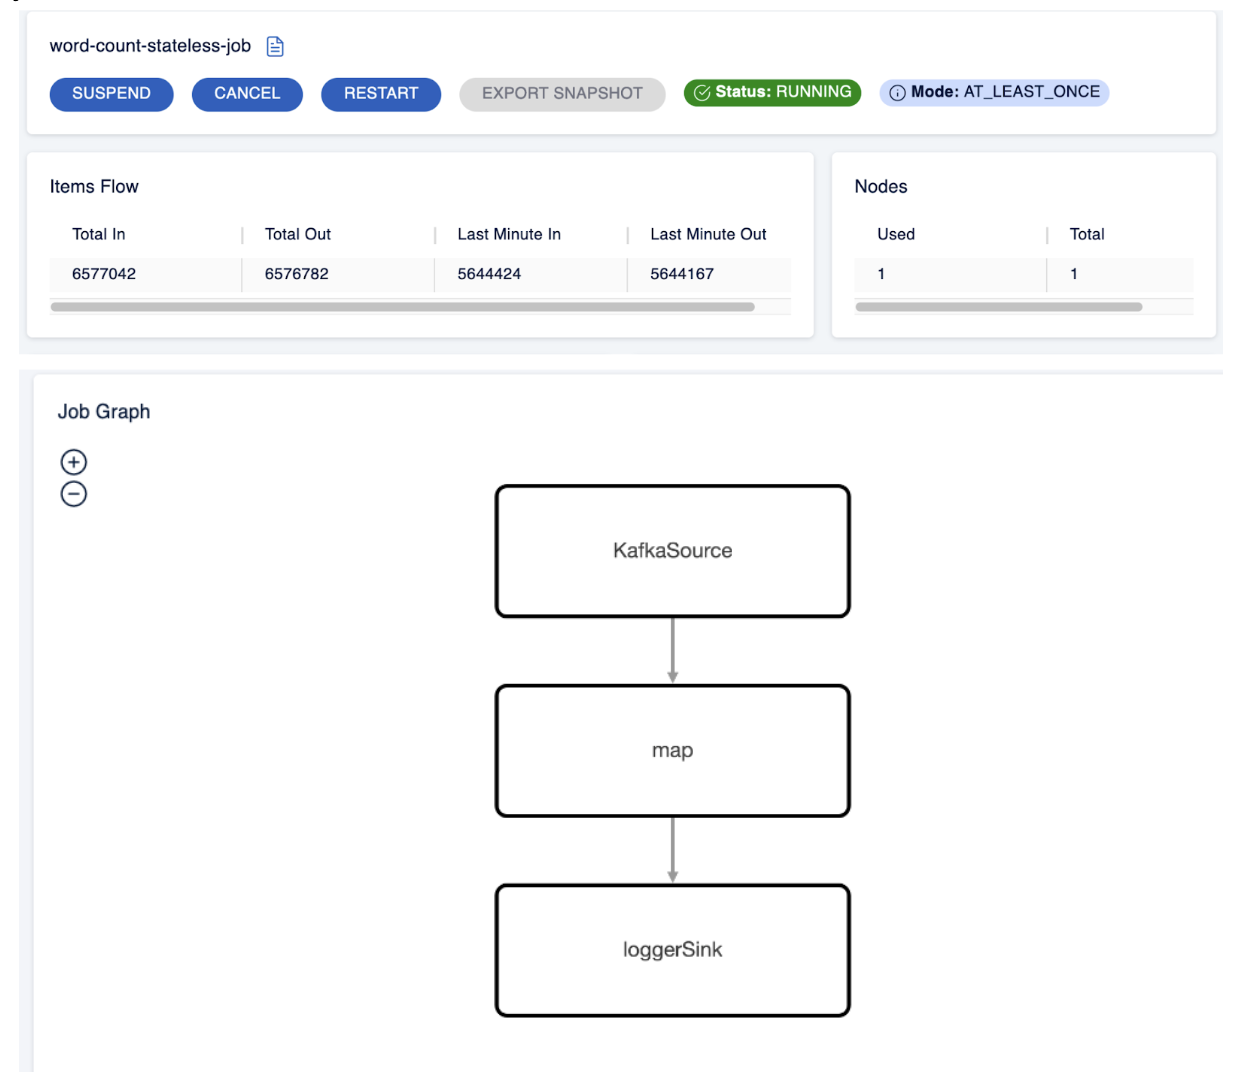
Among other things, you can head to the Jobs section to view details related to the jobs that ran in the cluster. Refer to the screenshot below:
Programmatically
Hazelcast also lets us view metrics programmatically using the getMetrics() API available in the Job class. Refer to this to get an idea of how to use it.
For more details on this, refer to the Hazelcast documentation here.
Tuning the cluster
We might have to play around with the cluster and job configuration to achieve the optimum throughput. Depending on the environment you are in, different parameters can help improve your setup. That being said, the Hazelcast team recommends that we only touch the configurations we are sure of. This section will go through some of the configurations likely to help in scaling your cluster.
Vertical scaling
We can always vertically scale our cluster by giving it more resources. Note that since this is in the context of a K8s environment, you can use the helm chart to allocate the right amount of CPU and RAM to a node in the cluster. Use this section of the helm chart to tune the values.
The number of CPUs you give to a node will directly be related to the number of Cooperative threads and the set Local Parallelism of a vertex. More on these terms later.
The amount of RAM can help you have larger Queue sizes.
Horizontal scaling
To scale the Hazelcast cluster horizontally, we can scale the Statefulset generated as a part of the helm installation to the number of replicas we want. Hazelcast handles the re-partitioning of the job automatically and transparently. More details can be found here.
Run the following command to scale your cluster:
kubectl scale sts word-count --replicas=NUMBER_OF_REPLICAS
Parallelism
Co-operative threads
An important configuration that helps in scaling is the number of cooperative threads per node. This defaults to the number of CPUs allocated to a node. In most scenarios, the default is good enough. In any case, you can tune this number to your requirements here. This document talks in detail about the cooperative multi-threading model which Hazelcast uses.
Vertex parallelism
Another configuration that goes hand in hand with Cooperative threads is Vertex parallelism. Each vertex/stage in the Hazelcast pipeline can have specific parallelism defined—an example of how to tune this can be found here. You can refer to the docs here for more information about this. Please note that Hazelcast doesn’t create new threads for the parallelism value. Instead, it uses cooperative threads to reduce context switching. For vertices that are non-cooperative, a new thread will be created.
Other parameters
We can configure the queue size if we see high GC or high memory usage. Queue size can be set like this. Queues act as a buffer between the vertices of a pipeline. Information on types of edges can be found here.
Latency can be affected depending on the type of processing guarantee we have set. It can be set as a part of the Job config (for example, here). Choose AT_LEAST_ONCE over EXACTLY_ONCE for better performance if the pipeline can gracefully deal with duplicates. More details are found here.
A complete example of available cluster configuration can be found here.
Summary
This blog post aimed to explain how to help Hazelcast users bootstrap a Hazelcast cluster in a Kubernetes-enabled environment. By deploying and managing Hazelcast clusters and writing stateless streaming jobs. We also explained how to integrate your Hazelcast pipeline with Kafka—submitting a simple job that, given a sentence as input, emits the number of words in that sentence. Don’t hesitate to share your experience with us in our community Slack or Github repository.
Further readings
https://docs.hazelcast.com/hazelcast/5.1/architecture/architecture
https://docs.hazelcast.com/hazelcast/5.1/capacity-planning#cluster-sizing
https://docs.hazelcast.com/hazelcast/5.1/deploy/deploying-in-kubernetes
References
[1] https://www.cncf.io/reports/helm-project-journey-report/
[2] https://hazelcast.com/product-features/management-center/