Hazeltest: A Guide to Testing Hazelcast Clusters
In this blog post, we are happy to work with our community member, Nico Krieg, a software developer, DevOps engineer and professional caffeine consumer. Below is Nico’s perspective on testing a Hazelcast cluster. Enjoy the read!
If you’re a software engineer, testing your source code is likely a vital part of your daily business, and it’s also likely that some (ideally, a high) degree of automation drives the tests. Maybe you’re even a fan of test-driven development, in which case you’ll surely agree that iterating between writing test code and writing business code is a super useful approach for improving code quality. As a software engineer, you need quick, reliable, and repeatable feedback on the fitness of your release candidates – the quicker the feedback arrives, the better, because it allows you to speed up your iterations on the code. Automating the testing process is the foundation for achieving this goal. The sheer abundance and variety of the various testing tools, libraries, and frameworks highlight the importance of building powerful automation for testing source code.
Testing A Hazelcast Cluster
Until here, you may be a bit surprised about the introductory section – what on earth does the software engineer’s view on testing have to do with Hazelcast and Hazeltest? But, trust me, it will all make sense, so stay with me to connect the dots.
Testing is Testing is Testing
You may have already guessed where this is going: If you’re not testing a piece of source code, but a Hazelcast cluster – or any technology in IT that has to fulfill a certain set of requirements – the kind of release candidate you’re supposed to test for fitness will be different, and hence the tests, as well as the testing process, will differ, but the goal for both is pretty much the same: to get quick, reliable, and repeatable feedback on the release candidate’s fitness, where fitness is defined as the ability of the release candidate to satisfy a certain set of requirements. And, just like in the software engineer’s view on testing, automation plays an important role in achieving this goal.
Experiences Thus Far
Because bits of the testing process and tools are a result of how we – a small team in a large corporation of the financial sector – use and deploy Hazelcast, we’ll have to take a look at this first. Don’t worry, I’ll make this as short as possible.
How We Use Hazelcast
Our team provides Hazelcast as a consumable middleware component in the corporation’s Kubernetes clusters. The means for formulating the “deployment contract” and rolling out Hazelcast is Helm, so the release candidates in our case are not the Hazelcast clusters as such, but the Helm charts which produce them. Hazelcast has been introduced to the corporation only very recently, so the processes surrounding the technology are still being shaped.
Internal teams responsible for various business applications tell us their requirements for data structures in Hazelcast (e.g. the naming and configuration of the data structures as well as the number and size of the entities to be stored, and the number of clients that will connect to the Hazelcast cluster). Other requirements for the more general architecture of the Hazelcast cluster, such as how the WAN replication is set up, are the result of a long analysis phase conducted shortly before I joined the project. When a team wants a configuration for one of their data structures to be updated, we modify the Helm chart to be deployed for the next release, thus creating a new release candidate.
There are two dimensions to making sure those release candidates are fit for production, namely, validating the chart’s syntactic correctness, and verifying the ability of the resulting Hazelcast cluster to satisfy all client requirements. The first part is very easy and, in its simplest form, can be achieved by simply running a helm lint in the build pipeline (we do go a bit beyond that in our pipeline with the help of a Helm chart quality gate that performs some additional checks on the rendered chart, but those checks, too, are relatively simple). The second bit – testing the Hazelcast cluster – is substantially more complex because the configuration of all data structures plus the configuration of the cluster itself have to be tested.
In the upcoming two sections, you’ll get introduced to the two ways we’ve used thus far for testing Hazelcast. (Spoiler alert: None of them was satisfying.)
Generate Load on Applications
The most obvious way for testing our Hazelcast clusters is to simply use the aforementioned business applications to generate load. They get deployed to the same Kubernetes clusters as containerized workloads and use Hazelcast to store state information, so when their endpoints are queried, they will put entries into specific data structures in Hazelcast. Thus, one can generate load there by simply invoking the applications’ endpoints, and while the teams responsible for them do that anyway for testing the integration with Hazelcast, this approach has a couple of drawbacks that disqualify it as means for us to perform automated testing:
- We don’t have access to the applications’ source code, so it’s hard to understand exactly how each application uses Hazelcast.
- The applications’ APIs are not under our control – some endpoints require authentication with test users we’re not allowed access to, so in these cases, we have to reach out to the responsible team simply to tell them to press the Go go gadget load test button somewhere, which gets old pretty quickly.
- Most importantly, the way the applications behave is – of course – dictated by their business requirements, so even their developers can’t change the behavior arbitrarily – for example, when an application requires two maps in Hazelcast to function correctly, we can’t tell the developers to make the application use 5.000 instead.
So, (mis)using the business applications for load generation on Hazelcast doesn’t seem to be a very effective approach. What other options are there?
Use PadoGrid
In case you haven’t heard of PadoGrid yet, it might be worth a look if you work with IMDG, messaging, or computing technologies such as Hazelcast, Redis, Hadoop, Kafka, or Spark. According to the project’s GitHub repo, the application (…) aims to deliver a data grid platform with out-of-the-box turnkey solutions to many enterprise architecture use cases. It’s easy to get started, so if the above sounds interesting to you, go give PadoGrid a try!
In the early days of testing our Hazelcast clusters, we almost exclusively used PadoGrid for load generation. To do so, we installed PadoGrid as a Pod next to the Hazelcast Pods, injected a test configuration, and then started an embedded test application, which gave us the ability to ingest as much data and as many entries as we wanted into the configured maps. This was sufficiently powerful to exhaust the memory and WAN replication capacity of the Hazelcast cluster under test in order to verify the cluster remained stable.
Testing with PadoGrid was notably better than using the business applications, but because PadoGrid has a much wider scope than merely testing Hazelcast, the load generation mechanism is subject to some limitations, which became an issue once the internal applications wishing to consume Hazelcast became more numerous and their requirements more sophisticated:
- PadoGrid offers its own simple, properties-based language to define tests, and by using it, it’s very easy to formulate a short-running test accessing a small number of data structures, but – revisiting an example made earlier on – to use, say, 5,000 maps, you’d have to hard-code 5,000 data structures as well as the operations to perform on them into the test configuration. Thus, the PadoGrid-based testing is limited to two load dimensions, namely, the number of entries as well as their size (hence the total amount of data to be stored in Hazelcast), but the notion of load consists of additional dimensions for Hazelcast, namely, the number of maps (which you can control in PadoGrid tests, but only to a very limited extent) and the number of clients. (Simply scaling out the number of PadoGrid instances would not have corresponded to an equally increased number of clients because the embedded testing app has to be launched within the Pod on an injected test configuration, and while an automated start would have been possible by assembling a new OCI image with a modified entry point and injecting the test configuration via a ConfigMap in the Helm chart, this wouldn’t have solved the other issues.)
- There is no possibility to configure randomness in the test configuration, so the load generated is very static and hence not realistic.
- The PadoGrid test language does not allow for defining test loops, so there is no way to come up with a long-running test (beyond simply copy-pasting the same test group definitions over and over again, that is).
- PadoGrid is not very talkative, so it’s difficult to figure out whether, for example, a null read on a key constitutes an issue with the Hazelcast cluster (e.g. memory exhausted, eviction kicked in) or is due to a faulty test configuration.
Sitrep: “Improvement Desirable”
The testing approaches outlined so far, then, did not provide the flexibility and control required to come up with the load scenarios necessary to test all aspects of our Hazelcast clusters. As a result, we found ourselves in a situation where we weren’t able to reproduce some issues reported by the teams consuming Hazelcast, making the troubleshooting very inefficient. Thus, we needed a way to improve on the versatility of load generation.
You may have also noticed the term “load generation” was used almost synonymously with “testing” in the sections above. This inaccuracy is due to load generation being the first aspect to testing Hazelcast clusters, so to get this aspect right is the minimum requirement for verifying a specific configuration is fit for production. Thus, because the load generation aspect is the starting point and we haven’t gotten it right yet, there was a lot of emphasis on this point, but there are other aspects, too, of course, namely, the collection of load generation results (i.e. reporting) and then acting on those results (i.e. their evaluation). Spoiler alert: Hazeltest will focus mainly on load generation, too.
Introduction To Hazeltest
The necessity for more versatile load generation gave birth to Hazeltest – a manifestation of the idea that we needed a dedicated application for testing our Hazelcast clusters. I decided to implement Hazeltest in my private time so the application can be open source, and my hope is that teams in other organizations may draw some benefit from the application, too.
Let’s start our tour of Hazeltest with a list of requirements for the application.
Requirements
Based on the drawbacks identified in the testing approaches employed thus far, Hazeltest must satisfy the following requirements:
Ease of use. Hazeltest must provide intelligent test logic supplied with default configurations that make sense for most use cases. The idea here is that launching a test against a Hazelcast cluster should be as straightforward as simply firing up the application.
Configuration flexibility. Yet again revisiting an example made earlier: Whether an application uses 2 maps in Hazelcast or 5,000 matters significantly, even if the number of entries stored across them and the size they amount to are roughly equal, and the same is true for other data structures. This is because Hazelcast must do some housekeeping work for each instance of a data structure, and hence the load generation possibilities become a lot more numerous when Hazeltest supports quickly and easily adjusting the number of used data structures. Other areas where flexibility is required include the size and number of entries, the number of clients, and the timing of operations. Being able to configure these things flexibly contributes to making Hazeltest more versatile because it will be able to generate a much wider range of load scenarios.
Elaborate logging. Understanding how complex workflows play out in various load or error scenarios on the client side helps isolate misconfigurations on the Hazelcast cluster side, hence Hazeltest – acting as the client – should inform elaborately about what it’s doing all the time. This information should be provided in such a way that logging platforms like Splunk or your friendly neighborhood ELK stack can easily index, search, and visualize the data.
Optimized for Kubernetes. As mentioned earlier, we run Hazelcast on Kubernetes, and all business applications consuming it get deployed to Kubernetes, too, so Hazeltest will run exclusively on Kubernetes (at least in this context, but designing the application to run on Kubernetes doesn’t mean one couldn’t simply launch the binary as-is on a trusty Linux machine, for example). For Hazeltest, this means the following:
- Necessity for liveness and readiness probes so the Kubernetes Deployment Controller won’t have to fly blindly when rolling out a new version, for example
- Small resource footprint so our Kubernetes clusters will be able to run a four-digit number of instances quite comfortably
- Scale-outs (e.g. going from one replica to 500) should happen quickly, so the application must have a very short bootstrap time
Intelligent test logic. The concept of intelligent test logic was mentioned above, and it is so central to the usefulness of Hazeltest that it deserves its own requirement. Basically, the idea that can be derived from PadoGrid’s testing capabilities is this: The freedom provided by the ability to define tests by means of the aforementioned properties-based language in plain-text files is amazing, but comes at the cost that defining long-running, complex tests is tedious. So what if you don’t need that much freedom, but simply a couple of pre-built “test loops” able to generate realistic load on a Hazelcast cluster? So, after start-up, Hazeltest should immediately engage test components that create realistic and heterogeneous load on the Hazelcast cluster under test, and ideally, these components can easily be run in an endless loop and come with reasonable defaults.
Meet Hazeltest!
Hazeltest is the result of the thoughts outlined above in combination with a whole lot of coffee, and you can find the application here on my GitHub.
The Foundation: Golang
Hazeltest is implemented in Golang for the following reasons:
- Container images for Golang applications tend to be very tiny
- Golang applications are enormously fast since they’re compiled directly into a binary file rather than requiring a virtual machine of some sorts to be run
- The language was built for concurrency, and as you’ll see later on, Golang’s concurrency features sit at the very core of Hazeltest
- Golang is awesome and I’ve been on the lookout for a useful, real-world project to learn it in, so learning Golang by implementing Hazeltest is really hitting two birds with one stone
- As a bonus, Golang has the most awesome mascot since the dawn of mascots!
So far, it seems that Golang is the perfect foundation for Hazeltest – the application starts in less than two seconds on our Kubernetes clusters (including the readiness checks becoming available, which take into consideration a successful connection to Hazelcast) and its image weighs in at roughly 10 MBs of compressed size, so even hundreds of instances requesting the image from the internal registry (in case of imagePullPolicy: Always) isn’t that big of a deal. Plus, goroutines are a really good fit for the individual runners the application offers (you’ll see considerably more of those runners later on).
Most importantly, though, implementing Hazeltest in Golang has been tremendous fun thus far, and I’m looking forward to learning more of the language and to applying it in the context of Hazeltest.
Run, Forrest, Run
At the very heart of a testing application sits – no surprise – some kind of testing logic, and in Hazeltest, this logic has been encapsulated in self-sufficient runners: For each data structure available in Hazelcast (maps, queues, topics, …), a set of runners puts load on Hazelcast (that’s the goal, at least, at the time of writing this, two runners are available for maps and queues each). Each runner has its own distinct “feature” in terms of the data it stores in Hazelcast, such that all runners combined create heterogeneous load. Those runners are also where Golang’s easy-to-use goroutines come in very handy as each runner gets its own goroutine so it’s isolated from the others. All runners for one kind of data structure instantiate a common test loop implementation, which encapsulates the actual interactions with the Hazelcast cluster, like ingesting, reading, and deleting data.
Encapsulating all configuration and a unique data structure to write to Hazelcast in a runner also has a nice side effect on the source code: Adding more runners does not increase complexity beyond simply making the program larger because the runner implementation is completely self-sufficient and so only adds another unit to the source code, but introduces no additional coupling to existing components other than to the test loop unit.
To take into account the “ease of use” requirement, Hazeltest immediately starts all enabled runners after bootstrap has been completed, so creating more load on Hazelcast is as simple as spawning more Hazeltest instances. In addition to that, the runners are configurable by means of a simple Yaml file, and each runner comes with sensible defaults so it is not mandatory to configure all properties.
Live Demo
Using Hazeltest
From here on, if you would like to follow along, you’ll need a reasonably juicy Kubernetes cluster at your disposal. In case you don’t have one yet, you may find this and this material useful.
Once your Kubernetes cluster is ready, clone the Hazeltest repo and navigate to the resources/charts directory. All commands and explanations in the following sections involving a file system path assume you’re in this directory.
Enabling And Disabling Runners
At the time of writing, four runners are available in Hazeltest: two for Hazelcast maps and two for Hazelcast queues. Each can be enabled and disabled individually by means of the hazeltest/values.yaml file, whose config element gets templated into a ConfigMap. The config element comes with one section for map tests and one for queue tests, encapsulating the map runners and queue runners, respectively. Each runner config, in turn, contains an enabled element you can use to enable or disable the runner in question. So, for example, the following config disables all runners but the map load runner:
config:

  queuetests:

    tweets:

      enabled: false

    load:

      enabled: false

  maptests:

    pokedex:

      enabled: false

    load:

      enabled: true
The following is a statement made earlier in this text: In addition to that, the runners are configurable by means of a simple Yaml file, and each runner comes with sensible defaults so it is not mandatory to configure all properties. Said defaults reside alongside the source code itself in the form of the defaultConfig.yaml file (which you can find in the program’s client package) and you’ll notice that, by default, all runners are enabled. So, what the config shown above does is overwrite the values for these specific properties. (That being said, it wasn’t necessary to provide the config.maptests.load.enabled property, it was included above only for clarity.) We’re going to make use of this overwriting mechanism a lot in the following sections. (In case you’re interested in how this mechanism arrived in its current state, this material might answer your questions.)
Configuring Sleeps
Once Hazeltest has started, all enabled runners will acquire a connection to the Hazelcast cluster under test and then start generating load by performing the interactions typical for the data structures they use in Hazelcast (inserts/reads/deletes for maps, put/poll for queues etc). Sleep configurations have been introduced for each kind of runner to enable users of the application to adjust the load generation to whatever they feel is realistic load on their clusters – after all, many business applications in organizations probably won’t hammer on their Hazelcast clusters continuously all the time.
The test loop for each runner works in terms of action batches and runs. For example, the current implementation of the map test loop executes three consecutive action batches (ingest all, read all, delete some, where some is a random number) in each run, where the batch size is equal to the number of elements in the data the runner works with (for example, the PokedexRunner works with the 151 items of the first-generation Pokédex, hence its batch size is 151). So, if the runner instantiating this test loop, for example said PokedexRunner, is configured with numRuns: 10000, it will execute these three action batches 10,000 times, after which it will signal to its caller that it’s finished. At the time of this writing, the following sleep configs are available for map runners and queue runners:
- Sleep between action batches: Will make the test loop sleep after having performed one batch of actions. For example, if the duration for this is configured to be 2.000 ms, a map test loop will sleep for 2.000 ms each time it has finished an ingest, read, or delete batch (or put/poll batch in case of a queue runner).
- Sleep between runs: Will make the test loop sleep before executing each set of action batches that constitute one run of the test loop. For example, in case of the map test loop, if the sleep is configured to last 5.000 ms, the runner will sleep that amount of time before executing its ingest, read, and delete batches.
In addition to that, an initial delay can be configured for the put and poll actions of queue runners (the idea being that, in a real-world scenario, there are usually two players involved in queue interaction, one which puts, and one which polls, and it’s fairly unrealistic for them to start precisely at the same time; rather, you’d probably expect the polling player to start a little later).
In terms of the runners’ YAML configuration, these sleeps can be configured as follows:
config:

  queuetests:

    # Using the TweetRunner as an example

    tweets:

      putConfig:

        sleeps:

          initialDelay:

            enabled: false

            durationMs: 2000

          # 'betweenActionBatches' and 'betweenRuns' analogous to map runner

      pollConfig:

        sleeps:

          initialDelay:

            enabled: true

            durationMs: 20000

          # 'betweenActionBatches' and 'betweenRuns' analogous to map runner

  maptests:

    # Using the PokedexRunner as an example

    pokedex:

      sleeps:

        # No 'initialDelay' for map runners

        betweenActionBatches:

          enabled: true

          durationMs: 2000

        betweenRuns:

          enabled: true

          durationMs: 3000
Right now, there is no option to randomize the sleep durations, which would probably make the load generated on Hazelcast more realistic, and I would like to add this as a feature in the future.
Adjusting Data Structure Usage
Earlier on, configuration flexibility was mentioned as one of the requirements Hazeltest must fulfill, and one dimension of this flexibility is the number of data structures used in Hazelcast. The underlying idea for how to make this happen in the application is very simple: By appending various identifiers to the name of the data structure (or omitting the identifiers), the number of data structures Hazeltest will create and use in the Hazelcast cluster can be drastically increased (or decreased). At the time of writing, there are two identifiers available to be appended to the data structure name: The unique ID of the Hazeltest instance creating the data structure on Hazelcast, and the index of the goroutine performing actions on the data structure.
Let’s see how this works by means of a simple example, again using the PokedexRunner as our object of configuration:
replicaCount: 1

# ...


config:

  maptests:

    load:

      enabled: false

    pokedex:

      enabled: true

      numMaps: 10

      appendMapIndexToMapName: true

      appendClientIdToMapName: false

      # ...
In this configuration, the LoadRunner is deactivated, so we can ignore its map settings. The PokedexRunner, on the other hand, is enabled and configured to spawn ten map goroutines. Because appendMapIndexToMapName is set to true, those ten goroutines will correspond to ten maps in Hazelcast since the runner will append the index of each goroutine to the map name (conversely, if this setting were false, even though the runner would still launch ten map goroutines, they would all be accessing the same map, so this would translate to only one map in the cluster). Meanwhile, appendClientIdToMapName is false, meaning the runners of this Hazeltest instance will not append this instance’s unique ID to the maps they use, so even if we had more than one Hazeltest instance running with the above configuration, the number of maps created in the Hazelcast cluster would still be ten as all instances would work with the same map names. On the other hand, if appendClientIdToMapName were set to true, each PokedexRunner in each Hazeltest instance using this configuration would work on its own batch of maps, thus significantly increasing the number of maps. In summary, with a replicaCount of 1 and only one runner active, the above configuration will create ten maps in the Hazelcast cluster.
Let’s see how we can drastically increase this number by tinkering around a bit with these properties:
replicaCount: 40

# ...


config:

  maptests:

    pokedex:

      enabled: true

      numMaps: 10

      appendMapIndexToMapName: true

      appendClientIdToMapName: true

      # ...

    load:

      enabled: true

      numMaps: 5

      appendMapIndexToMapName: true

      appendClientIdToMapName: true

      # ...
The most apparent change is that the number of replicas is much higher, but if the above configuration were identical to the first configuration apart from the replicaCount value, it would still give us very few maps (10 for the PokedexRunner and 5 for the LoadRunner). The trick is that this time, appendClientIdToMapName is true for both runners, so each runner in each Hazeltest instance will work on its very own batch of maps. The number of maps in each batch is controlled by the numMaps property. So, the above configuration gives us the following map counts:
- PokedexRunner: 40 instances * 10 maps each –> 400 maps
- LoadRunner: 40 instances * 5 maps each –> 200 maps
With a total of 600 maps, the load those Hazeltest instances will put on the Hazelcast cluster is quite a lot higher compared to the first example configuration. Thus, simply playing around with the number of Hazeltest instances, the number of maps used for each runner, and the two append* properties yields vastly different results in terms of the map usage on the Hazelcast cluster those instances work with. (The examples above were made with map runners, but the append* properties as well as how they play out in the runner behavior work in exactly the same way for queue runners, too.)
Short-Running Versus Long-Running Tests
The following example will introduce the map runner config’s numRuns property in the context of configuring how long a test runs (the example is made for maps again because they are more often used in Hazelcast than queues, but the concept works in the same way for the queue runners with the exception that the queue runners’ configs embed these properties in a dedicated putConfig and pollConfig). Let’s use our ol’ reliable, the PokedexRunner, again, and disable all other runners:
config:

  queuetests:

    tweets:

      enabled: false

    load:

      enabled: false

  maptests:

    pokedex:

      numMaps: 1

      numRuns: 2

      sleeps:

        betweenActionBatches:

          enabled: false

        betweenRuns:

          enabled: true

          durationMs: 5000

    load:

      enabled: false
To make the logging output of the runner as straightforward as possible, I’ve given it only one map to work with, but the important piece of configuration here is the numRuns: 2 property in combination with the sleeps.betweenRuns config. They will produce a fairly short test duration of roughly 15 seconds, caused by two sleeps of 5 seconds each plus the time it takes for the map operations to complete. The following two excerpts from the Hazeltest Pod’s logs show this (watch out for the time field at the end of the line):
| {“caller”:“/app/maps/testloop.go:51”,”client”:“f361035e-7ef9-4989-87fd-1b0508c382bb”,”dataStructureName”:“ht_pokedex-0”,”file”:“/app/logging/logging.go:142”,”func”:“hazeltest/logging.(*LogProvider).doLog”,”kind”:“timing info”,”level”:“info”,”msg”:“‘getMap()’ took 5 ms”,”operation”:“getMap()”,”time”:“2022-09-23T16:54:46Z”,”tookMs”:5}
|
| {“caller”:“/app/maps/testloop.go:111”,”client”:“f361035e-7ef9-4989-87fd-1b0508c382bb”,”file”:“/app/logging/logging.go:142”,”func”:“hazeltest/logging.(*LogProvider).doLog”,”kind”:“internal state info”,”level”:“info”,”msg”:“map test loop done on map ‘ht_pokedex-0’ in map goroutine 0”,”time”:“2022-09-23T16:55:00Z”} |
(You could make the test even shorter if you were to disable the betweenRuns sleep – I’ve only activated it here to generate a more visible difference between the two timestamps.)
Similarly, to achieve a very long-running test, simply adjust the numRuns property upwards to whatever you need – in the default config, the value is set to 10,000 for the two available map runners, which, assuming the default sleep configs, will keep the runners busy for a couple of hours. In case you still need more, though, the internal property representing the number of runs is a uint32, so you can provide a maximum value of 4,294,967,295, which won’t produce an endless loop as such, but one running long enough it might just outlive you.
Load-Generation Example: Scenario 1
So, with all the theory and basics out of the way, let’s finally get our hands dirty and put Hazeltest to some good use! The following paragraphs will introduce you to the first of three scenarios, each of which comes with its own configurations for both Hazelcast and Hazeltest.
Each scenario links to a subdirectory of the blog-examples repo containing values.yaml files in ascending order of usage (meaning you can also view the files for scenarios 2 and 3 there in case you wish to jump ahead, but please keep in mind these files are still work-in-progress). The hazeltest/hazeltest_livestream_1/scenario_1 directory contains all files we’re going to need in the following paragraphs.
The following is an excerpt from the Hazelcast configuration we’re going to start with (full file here), showing only the pieces of configuration relevant for this scenario in order to keep things short and simple:
map:

  default:

    backup-count: 0

    max-idle-seconds: 30

  app1*:

    backup-count: 1

    max-idle-seconds: 600

    eviction:

      # ...

  app2*:

    backup-count: 2

    max-idle-seconds: 120

    eviction:

      # ...
So, we have two application-specific map configs and one default config that attempts to protect the cluster from misbehaving clients (i.e. clients requesting maps that have not been explicitly configured) by setting a low max-idle-seconds value and not providing them with any backups for their map entries.
And here’s the challenger on the other side of the ring (again showing only the relevant bits, this one is the full file):
replicaCount: 2


# ...


config:

  # ...

  maptests:

    pokedex:

      enabled: true

      numMaps: 10

      appendMapIndexToMapName: false

      appendClientIdToMapName: false

      mapPrefix:

        enabled: true

        prefix: "app_1_"

      sleeps:

        # ...

    load:

      enabled: true

      numMaps: 10

      appendMapIndexToMapName: false

      appendClientIdToMapName: false

      mapPrefix:

        enabled: true

        prefix: "app1_"

      sleeps:

        # ...
Note how both append* properties have been set to false for both runners, so with a replica count of 2 and 10 map goroutines, we’ll still end up with only two maps in the Hazelcast cluster (granted, the naming of the numMaps property might be a bit misleading). Also, you’ve probably seen the deliberate error in this configuration: The map prefix for the PokedexRunner is app_1_ rather than app1_, and since there is no such map name in our Hazelcast config, the default config will apply for this map.
Let’s start Hazelcast and then generate some load with Hazeltest (because Hazelcast is deployed as a StatefulSet and I’d like to keep the time for re-creating a clean state as short as possible, the Hazelcast cluster only has one member, but you can, of course, adjust that to whatever you like):
# Install Hazelcast with Management Center

$ helm upgrade --install hazelcastwithmancenter ./hazelcastwithmancenter --namespace=hazelcastplatform --create-namespace


# Install Hazeltest once the Hazelcast Pod has achieved readiness

$ helm upgrade --install hazeltest-app1 ./hazeltest --namespace=hazelcastplatform
This should give you roughly the following:
# As always

$ alias k=kubectl


# Query state in namespace

$ k -n hazelcastplatform get po

NAME                                       READY   STATUS    RESTARTS   AGE

hazelcastimdg-0                            1/1     Running   0          14m

hazelcastimdg-mancenter-67d8b898b4-bvmvc   1/1     Running   0          14m

hazeltest-app1-856d9dc74b-447cv            1/1     Running   0          12m

hazeltest-app1-856d9dc74b-xbjl9            1/1     Running   0          12m
As you can see there, the Pods have been running for a while in my case, which means our Hazelcast cluster seems to be doing pretty okay. Let’s check the Management Center (exposed through a NodePort-type Service) in order to verify all is well:
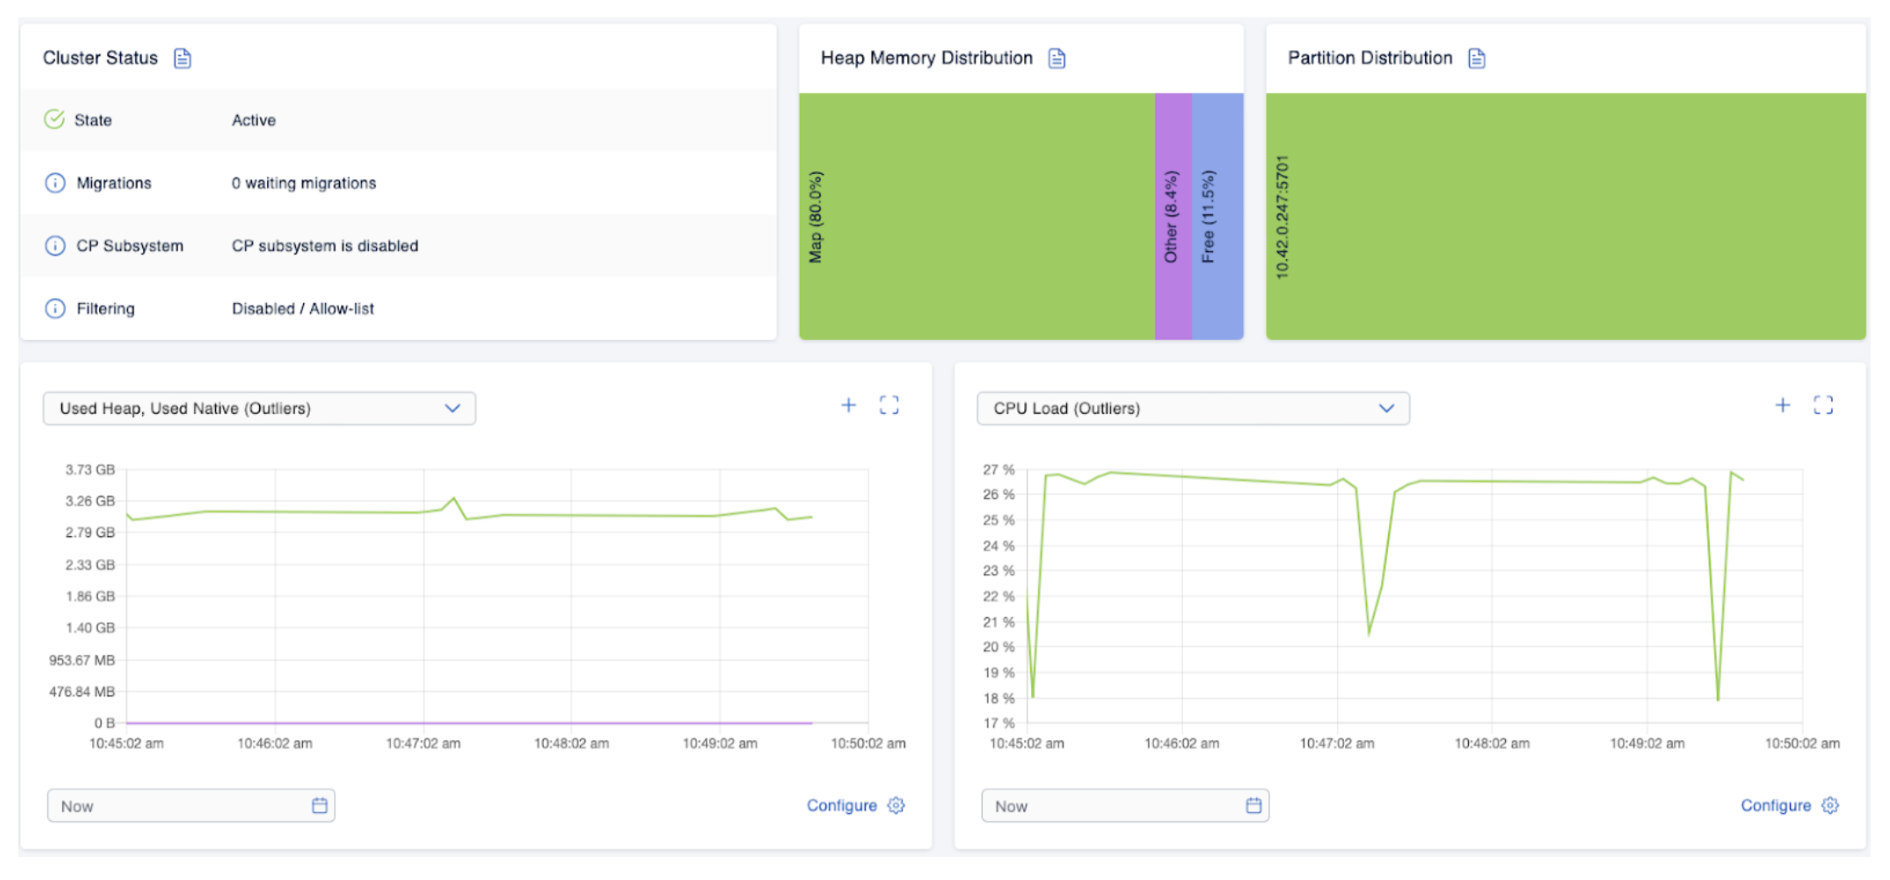
Indeed, the cluster is doing fine, with the overall memory used for maps staying at roughly 80% of the available heap. Let’s also check out the maps those two Hazeltest instances have created:
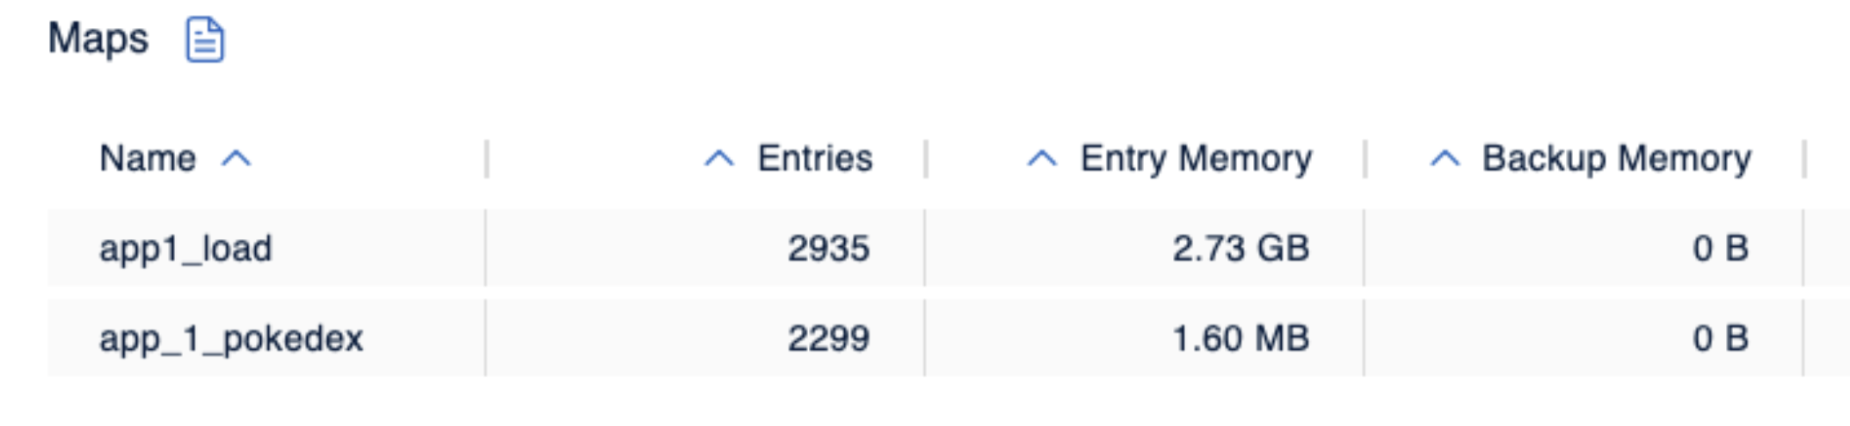
So, while the two maps are not that far apart in terms of their entry count, the app_1_pokedex map occupies far less memory. The ensuing question, then, would be this: Is the default map configuration restrictive enough to protect the Hazelcast cluster if a client writes more and larger data?
To find out, here’s another Hazeltest file we’re going to apply shortly (only showing the relevant differences to the first Hazeltest file – you can find the full file here):
maptests:

  pokedex:

    # ...

    mapPrefix:

      enabled: true

      prefix: "app_2_"

    sleeps:

      # ...

  load:

    mapPrefix:

      enabled: true

      prefix: "app_2_"

    sleeps:

      # ...
In other words, another misbehaving client makes its appearance, and this time, the LoadRunner will catch the default map configuration, too. Once Hazeltest has been installed with this configuration (note the different release name!).
# Deploy as 'hazeltest-app2'

$ helm upgrade --install hazeltest-app2 ./hazeltest --namespace=hazelcastplatform


# Setup watch for Hazelcast Pod so we can see if the member crashes

$ watch kubectl -n hazelcastplatform get po --selector="app.kubernetes.io/name=hazelcastimdg"

NAME              READY   STATUS    RESTARTS      AGE

hazelcastimdg-0   1/1     Running   0             54m
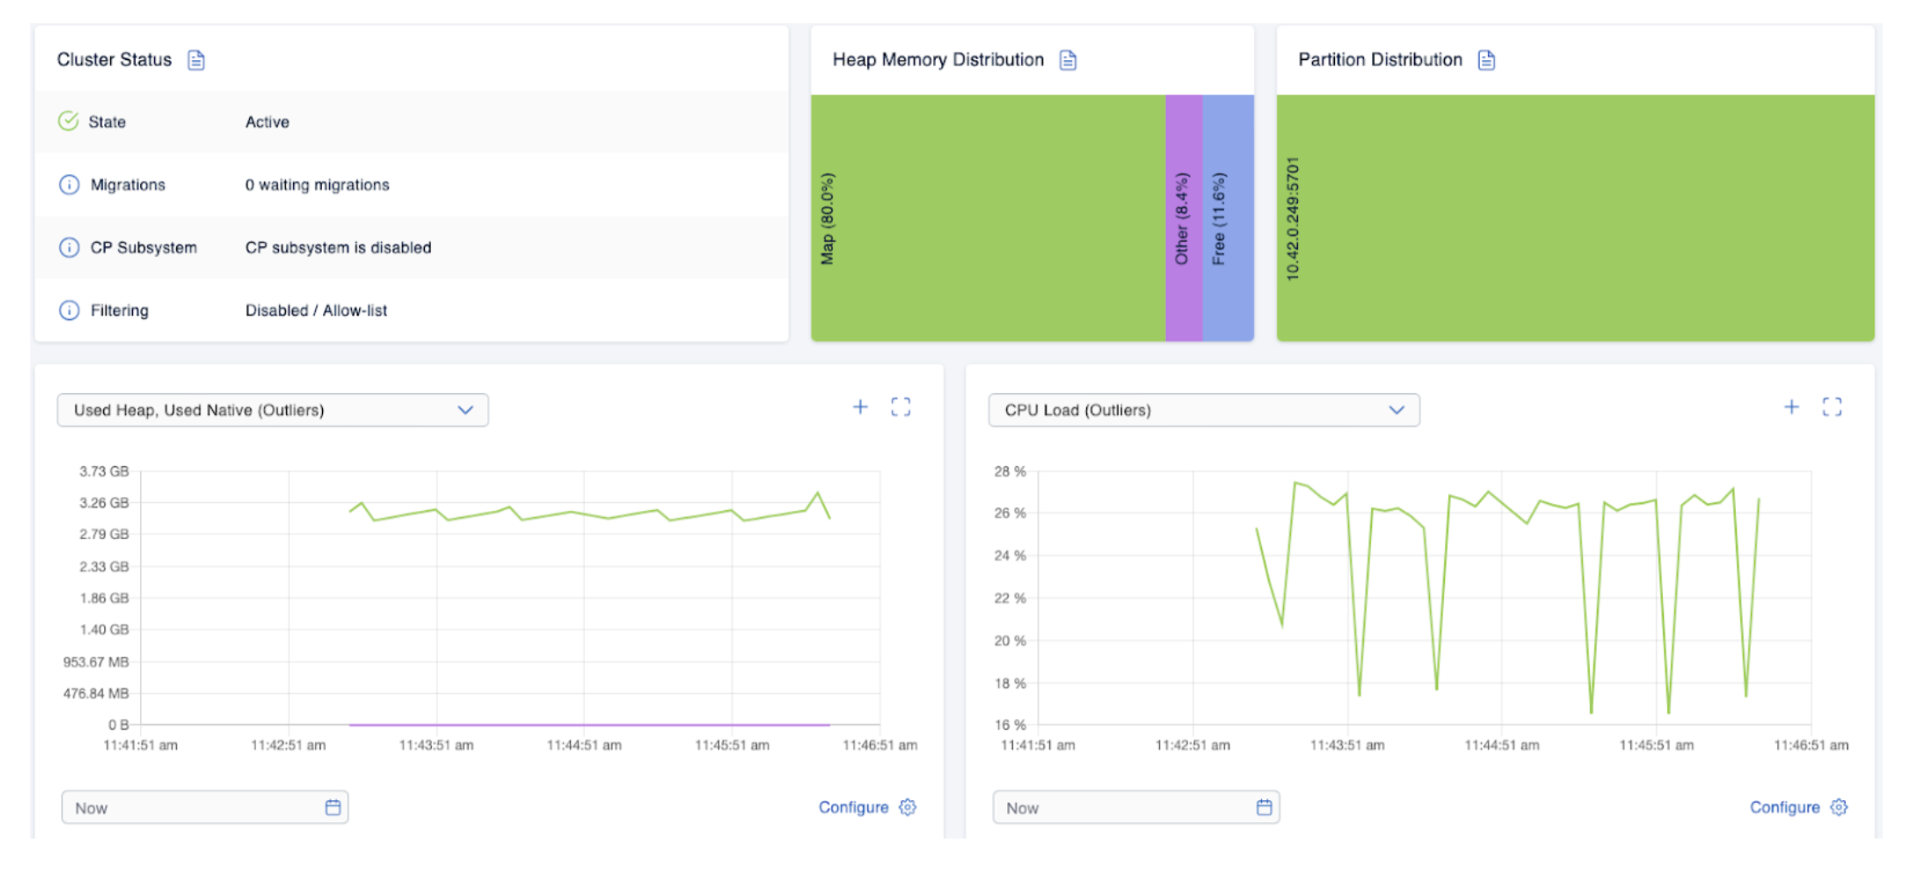
… the Hazelcast cluster will start to struggle:

The heap usage increases, and so, inevitably, the cluster member crashes with the infamous OutOfMemoryError:
$ watch kubectl -n hazelcastplatform get po --selector="app.kubernetes.io/name=hazelcastimdg"

NAME              READY   STATUS    RESTARTS      AGE

hazelcastimdg-0   1/1     Running   1 (41s ago)   57m


# Check logs of previous Pod

$ k -n hazelcastplatform logs hazelcastimdg-0 --previous

# ...

java.lang.OutOfMemoryError: Java heap space

# ...
As it turns out, then, the default map configuration wasn’t quite defensive enough. To improve on this, we could specify a lower value for max-idle-seconds and provide an eviction policy (excerpt from this file):
map:

  default:

    backup-count: 0

    max-idle-seconds: 5

    in-memory-format: BINARY

    eviction:

      eviction-policy: LRU

      max-size-policy: FREE_HEAP_PERCENTAGE

      size: 85
Once you’ve updated the values.yaml file for Hazelcast, simply install a new revision for the Hazelcast release (the Hazelcast StatefulSet’s Pod template contains the Helm revision in an annotation, so with every revision update, a new Pod will be created):
# Install new Hazelcast revision

$ helm upgrade --install hazelcastwithmancenter ./hazelcastwithmancenter --namespace=hazelcastplatform
As long as the Hazelcast Pod hasn’t become ready yet, the Hazeltest instances will complain they’ve got no Hazelcast cluster to connect to, but that’s fine – as soon as the Hazelcast Pod has achieved readiness, they will reconnect and get back to their load generation tasks, the results of which we can soon see in the Management Center:
After some time, the Hazelcast Pod still looks pretty good:
# Watch from earlier

$ watch kubectl -n hazelcastplatform get po --selector="app.kubernetes.io/name=hazelcastimdg"

NAME              READY   STATUS    RESTARTS   AGE

hazelcastimdg-0   1/1     Running   0          11m
This concludes scenario 1, delivering a cluster config suitable for the load generated by Hazeltest thus far. You can run the following commands to clean up all the resources created thus far:
# Uninstall Hazeltest ("hazeltest-app1")

$ helm uninstall hazeltest-app1 --namespace=hazelcastplatform


# Uninstall Hazeltest ("hazeltest-app2")

$ helm uninstall hazeltest-app2 --namespace=hazelcastplatform


# Uninstall Hazelcast

$ helm uninstall hazelcastwithmancenter --namespace=hazelcastplatform


# ... or simply get rid of the namespace altogether

$ k delete ns hazelcastplatform
Summary
We’ve seen that even when you’re not a software engineer, it appears to be useful to put yourself in the shoes of one with regard to testing release candidate fitness because the paradigm thus assumed delivers a goal very worthy of pursuit: To build powerful automation for testing whatever release candidate you’re responsible for in order to generate quick, reliable, and repeatable feedback on its fitness for production in terms of a given requirement set.
My current project team and I are responsible for making sure our organization’s Hazelcast clusters are up to the challenge, no matter what the various business applications might throw at them. Here, the release candidate is a Helm chart that will create the Hazelcast cluster on Kubernetes, and while it’s pretty simple to verify the syntactic correctness of the chart, asserting the correctness of the Hazelcast cluster configuration it defines is an entirely different story.
The testing means my team and I applied thus far have not delivered satisfying results, and Hazeltest is my humble attempt to deliver a better, more useful means; one that is more closely aligned with the goal of automating the testing process or, at the very least, automating the process of generating different kinds of load. Hazeltest is open-source, implemented in Golang, and its basic idea is that its internal so-called runners create realistic load on the Hazelcast cluster under test, where each runner can be flexibly configured so teams responsible for testing Hazelcast in organizations can fine-tune the load generation behavior to their needs. Thus, Hazeltest focuses on testing the Hazelcast cluster itself rather than the release candidate – some bundled set of configuration, possibly in a standardized format like a Helm chart – that it was brought forward by.
The practical examples in the preceding sections introduced you to the basics of operating Hazeltest by showcasing its most important configuration aspects and using the application in scope of a simple load-generation scenario. In this scenario, we’ve configured Hazeltest in such a way that its load runner revealed the default map config was not defensive enough to protect the Hazelcast cluster from misbehaving clients that write too much data too quickly.
We look forward to your feedback and comments about this blog and Hazeltest. Don’t hesitate to share your experience with everyone in the Slack community or Github repository. You can reach Nico Krieg on LinkedIn.