
Vladimir is a product manager with an engineering background and deep expertise in stream processing and real-time data pipelines. Ten years of building internal software platforms and development infrastructure have made him passionate about new technologies and finding ways to simplify data processing. Vladimir co-authored two white papers on the topic: Understanding Stream Processing: Fast Processing of Infinite and Big Data, and A Reference Guide to Stream Processing. His tutorial video on stream processing and real-time data pipelines discusses the building blocks of a stream processing pipeline and demonstrates how developers can write a full-blown streaming pipeline in less than a hundred lines of Java code for a variety of applications. Vladimir is also a lecturer with the Czechitas Foundation, whose mission is to inspire women and girls to explore the world of information technology. Czechitas Foundation teaches coding in various programming languages, software testing, and data analysis.
View all blogs by the authorJul 11, 2017
Hazelcast Jet 0.4 Performance Review
High performance has always been a major design goal of Hazelcast Jet. In order to verify various performance aspects of Jet, we’ve introduced the following benchmarks:
- Word count, to measure and compare the raw computational power during batch processing.
- Trade monitor, which is based on a streaming aggregation and involves windowing and event-time based processing.
- 5,000 jobs benchmark which was motivated by use cases where thousands of various data processing feeds run on the same cluster. Parallelism is achieved by sharing the resources among sequential jobs rather than parallelizing one job.
Let’s have a closer look at the results and the reasoning behind Jet’s performance.
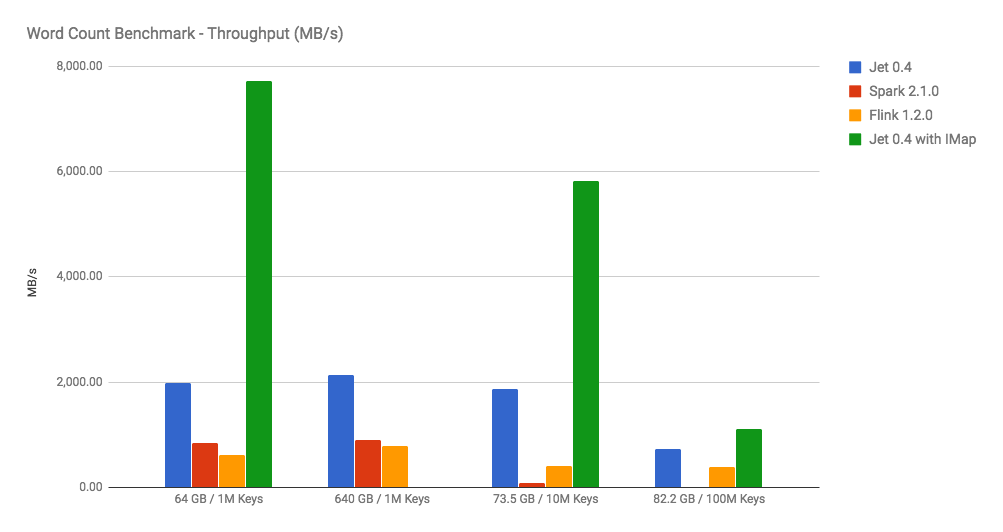
Word Count
Word count is the “hello world” of the big data world and we have chosen it to compare the raw power of data processing frameworks. Mapping and aggregation as found in this problem are building blocks of more complex data processing algorithms and word count itself is simple and highly parallelizable, with no particular shortcuts available. It emphasizes the raw throughput and overhead of the framework itself.
The chart with benchmark results shows Jet outperforming Apache Spark and Apache Flink by being able to process more than 2 GB per second (640GB data set, 1M distinct keys). See the complete benchmark (hardware, environment, data sets and configuration used).
Green Threads
The key to the performance of Jet is its use of Directed Acyclic Graphs [1] or DAGs, as a task processing model.
With Jet, the number of parallel instances of each vertex (called Processors) can be defined so that we can use all the cores, even in the largest machines. With many cores and execution threads, the key to Hazelcast Jet performance is to smoothly coordinate these with cooperative multi-threading. Hazelcast Jet uses “Green Threads” [2] where cooperative processors run in a loop serviced by the same native thread. This leads to:
- Practically zero cost of context switching. There is hardly any logic in the worker thread needed to hand over from one processor to the next.
- (Next to) guaranteed core affinity. Processors don’t jump between threads and each thread is highly likely to remain pinned to a core. This means high CPU cache hit rate.
- Insight into which processor is ready to run. We can inspect the processor’s input/output queues at very low cost to see whether it can make progress.
Using Embedded Hazelcast IMDG
The benchmark uses the Hadoop Distributed File System as a source and sink. We’ve also added one extra run where Jet reads the data set from a Hazelcast IMap. Of course, it’s not an apples-to-apples comparison, however many Jet users will benefit from the Hazelcast IMDG distributed data structures embedded in Jet. As you see, with this setup Jet is able to process almost 8 GB/sec with data sets that fit into the cluster memory.
Apart from the in-memory approach boost, Jet takes advantage of data locality by reading from local partitions.
Streaming Latency (Trade Monitor)
With the 0.4 release, Jet introduced windowing and event-time processing. Both features made Jet stronger and more useful in the infinite stream processing domain. Low latency at scale is the raison d’être of streaming, so our streaming benchmark was focused on measuring the average framework latency in various conditions (message throughput, window set-ups). Kafka was used as an input data source.
Again, Jet outperformed both Spark Streaming and Flink. See the complete streaming benchmark.


The difference becomes more obvious with larger sliding windows, where Jet’s throughput capacity stays flat with increasing window size. Sliding windows are fixed size windows that can overlap. The window slides in fixed increments as time advances, which is called a sliding step. Tumbling windows, being fixed-size non-overlapping windows, are a special case of sliding windows (the sliding step equals the window size).
Combining and Deducting Frames
The rationale behind performance characteristics of Jet lies in:
- Efficient windowing storage reducing Java Garbage Collection impact
- Smooth sliding step handling
Under the hood, Jet uses Frames as the building blocks of sliding windows. A frame covers a section of the stream equivalent to a sliding step. When a record arrives, it is added to the respective frame. For each frame, just the rolling accumulator is stored instead of buffering all the items. When the window is closed, mostly by a time or count limit reached, respective frames are combined and the computation is executed. This provides a trade-off between the smoothness of sliding and the cost of storage/computation.

Moreover, there is a deduct function to optimize sliding window computations. When windows slide, deduct just removes the trailing frame from the sliding window and adds the new one. This means two operations instead of recomputing the whole sliding window from the underlying frames with every sliding step.
Not every operation can use the rolling accumulator (think about accumulating items for widowed sort, one has to buffer the items) and not every frame can be deducted from the window (max operation for example). However, where applicable, both optimizations provide significant performance boost.
Kafka Notes
The latency of Jet seems to be influenced by reading from Kafka. Kafka batches the records before flushing to disk, and prior to sending data to the clients to reduce overhead and achieve higher throughput. It’s not intended to be ultra low-latency. We expect Jet to produce even better results with a low-latency streaming source.
5,000 Jobs
Jet is application embeddable and lightweight. It’s expected to be used for IoT edge processing, i.e., processing out in the field, close to the data source. Therefore, having thousands of small jobs running in one instance/cluster is more likely than hosting one big job. The 5,000 job benchmark was intended to prove this usage profile.
We expected Jet to handle numerous jobs well, due to its cooperative multi-threading core. In our benchmark, a 2 node Jet cluster was able to handle 10 million messages per sec when working on 5,000 jobs, or 5 million messages/sec with 10,000 jobs when using just cooperative processors. When using non-cooperative, blocking source and sink for each Job, Jet was still able to handle 100,000 messages/sec with 2,000 jobs.