Performance Benchmarks
Hazelcast vs Gridgain
Hazelcast and GridGain provide performance and scalability for in-memory data grid use cases. Developers can embed instances in the application server or as process instances on dedicated hardware. Any member of a cluster can communicate with any other. Data is replicated across physical servers for redundancy. Both Hazelcast and Apache Ignite/GridGain support distributed and replicated Caches, Query and Execution.
But in almost all other in-memory computing and stream processing use cases, Hazelcast is the better choice. Hazelcast supports Reliable Topics, Ringbuffers, Maps, MultiMaps, Sets, Lists, HyperLogLogs, and EventJournal out of the box. Also, the Hazelcast CP subsystem is a component of a Hazelcast cluster that builds an in-memory strongly consistent layer. Its data structures always maintain linearizability and prefer consistency over availability during network partitions.
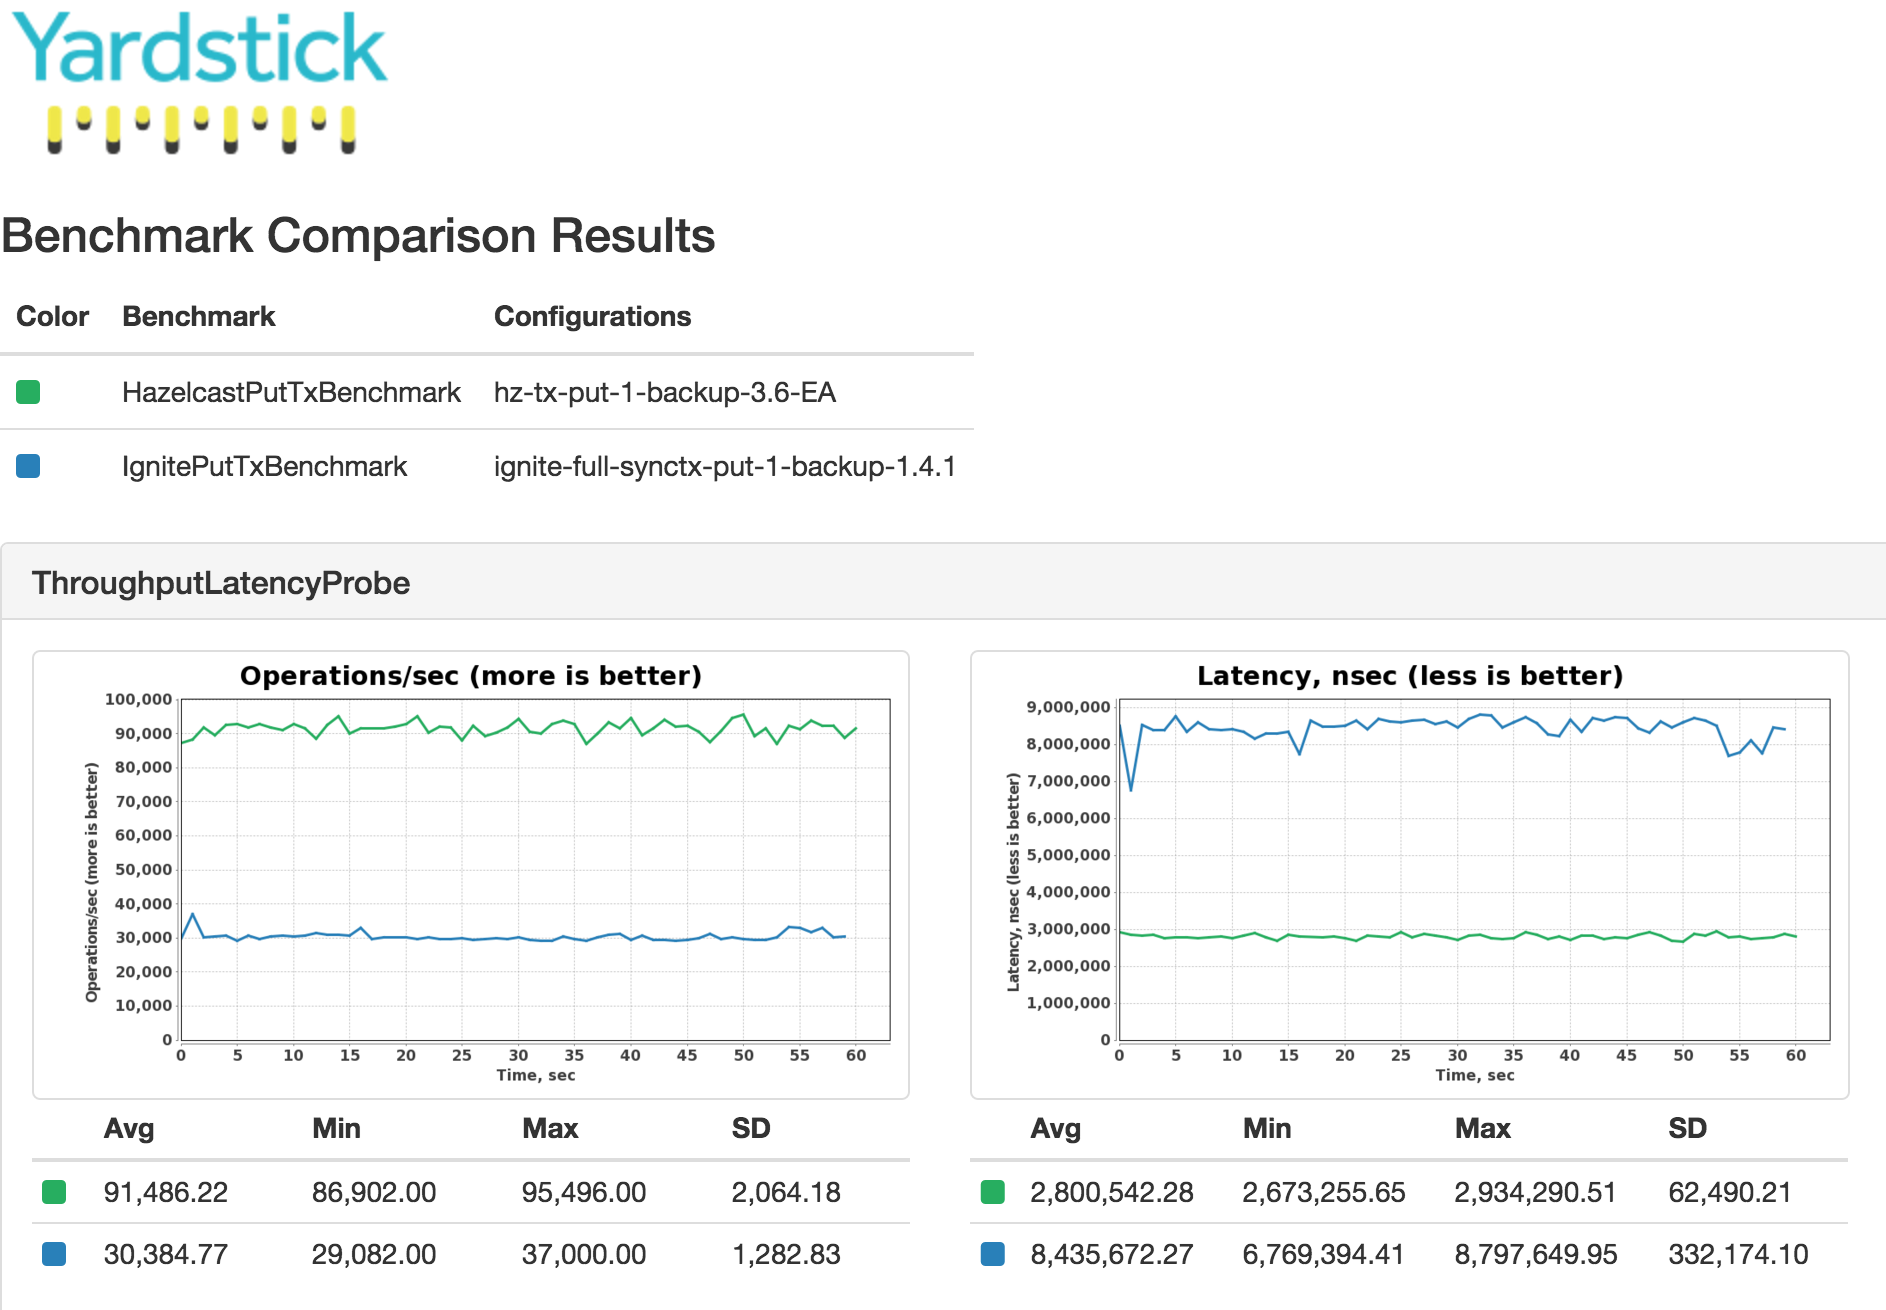
Hazelcast has run performance benchmarks against GridGain and makes the following assertions:
- Hazelcast consistently outperforms Gridgain at scale. Benchmarks show that Hazelcast has up to 90% more throughput with lower latencies.
- Published benchmarks by GridGain are flawed. GridGain benchmarks used different configurations between their technology and Hazelcast, unfairly skewing the results. In fair and equivalent tests, Hazelcast shows a significant performance advantage over GridGain.
- Hazelcast is committed to delivering high performance. Hazelcast strives for fair benchmarks and welcomes independent benchmarking. Hazelcasts not only publishes benchmark results but also documents the environment and test tools so anyone can confirm the performance advantage themselves.
Recent Benchmark Results
Our latest performance benchmark tests compare Hazelcast Enterprise 3.6 versus GridGain 7.4 (Apache Ignite 1.4.1).
The table below shows some key performance metrics:
| Key Metrics | Hazelcast | Gridgain (Apache Ignite) |
|---|---|---|
JCache Put | Avg. operations/sec (higher is better)
Latency in ns (lower is better)
| Avg. operations/sec (higher is better)
Latency in ns (lower is better)
|
JCache Put/Get | Avg. operations/sec (higher is better)
Latency in ns (lower is better)
| Avg. operations/sec (higher is better)
Latency in ns (lower is better)
|
