
Development Team Lead, Hazelcast Cloud
Hüseyin BABAL is currently the development team lead of Hazelcast Cloud. He mainly focused on building SaaS on multi-cloud platforms based on Kubernetes and talking about those topics in public events. Prior to joining Hazelcast, he worked as Software Architect in eBay and Sony for their devops and microservices transition process.
View all blogs by the authorAug 21, 2020
Postmortem Chronicles – Prometheus is Good, But Be Careful!
On August 6, we detected and fixed a production issue that showed the wrong cluster status in Hazelcast Cloud Console. When you click the Stop Cluster button, it stays in Stopping state even after your cluster is shutdown. I was a bit confused since this system is already running for almost 2 years, but why did it happen recently? In this article, I talk about how we are using Prometheus then provide more detail about the root cause of the issue and how we fixed it.
Alert Management Architecture
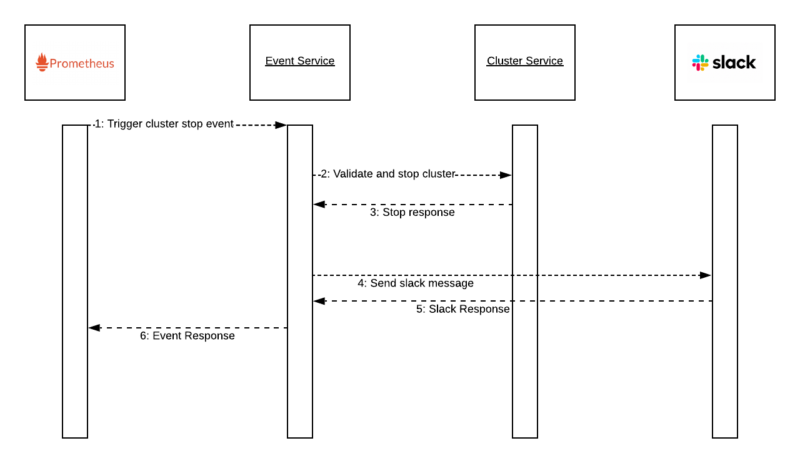
Hazelcast Cloud is based on Kubernetes. As a result, we are using Prometheus to monitor the critical components due to easy integration. We collect metrics to show them in dashboards like Grafana, and trigger events based on some predefined rules. To trigger events:
- We define rules based on Hazelcast Cluster metrics.
- We define receivers to collect these alarms and route to the destination, which is a REST endpoint in our case. You can also see triggered events in the Prometheus alarm web page even if you don’t define a receiver.
Defining Alert Management Rules
One of the rules in Hazelcast Cloud is FreeIdleCluster which is for stopping the clusters that are idle more than 16 hours.
groups:
- name: rules
  rules:
  - alert: FreeIdleCluster
    expr: rate(hazelcast_cluster_stats{cluster_type="FREE",statname="total_operation_count"}[1m]) == 0
    for: 16h
    annotations:
        summary: 'Cluster [{{ $labels.cluster_id}}] is idle cluster'
        clusterid: '{{ $labels.cluster_id}}'
        customerid: '{{ $labels.customer_id}}'
        clusterName: '{{ $labels.cluster_name}}'
        stack: '{{ $labels.environment}}'
        eventtype: FREE_IDLE_CLUSTER
    labels:
        urgency: medium
        eventtype: FREE_IDLE_CLUSTER
        environment: '{{ $labels.environment }}'
Firstly, if expr is valid for the last 16h interval, Prometheus will trigger an alert. Secondly, we use total_operation_count coming from hazelcast metrics. Annotations and labels are important since those values will be shown in the Alerts page and will also be used inside the REST request payload. Above all, they are all handled by the Prometheus Alert Manager component.
Sending Alerts to Specific Destinations
We define receivers and routes to send these alerts to external services to trigger events. Receivers are for defining the destination like email, Slack, REST endpoint, etc…, while routes are for matching alerts based on their labels and send it to destination.
receivers:
    - name: event-service
    webhook_configs:
    - url: https://event.service/prometheus
        http_config:
        bearer_token: '<jwt_token>'
If your service is restricted, you can add bearer token so that the alert manager will inject this to request headers. To know which fields are sent in the request payload, you can use a mocked endpoint that prints this payload, this tool is very handy to do that.
 route:
      group_by: ['stack_name', 'alertname']
      group_wait: 30s
      group_interval: 1m
      repeat_interval: 3h
      routes:
      - match_re:
          environment: dev
        receiver: event-service
        continue: true
According to the above definition, all the alerts that contain environment: dev will be routed to the event-service receiver.
Some Traces of Production Issue
The number of clusters that has the Stopping state started to increase, and at the same time, we started to get exceptions coming from microservices. Firstly, one of the messages was, Channel is not found, coming from our notification service. Then, when I check our Slack management page, I realized the webhook we use for this operation is disabled! The owner of this webhook is no longer involved with this project and Slack disabled it. Let’s have a look the final state after this problem;
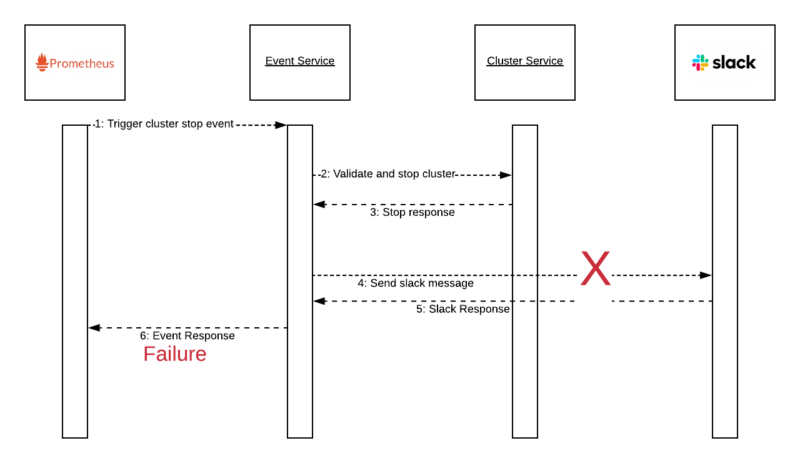
Event Service successfully stops the cluster, but cannot send the message due to missing webhook in Slack. As a result, Event Service responds failure to Prometheus Alert Manager. If Prometheus Alert Manager does not see an OK response from the external endpoint, it will not mark this alert as fixed and will try to send it again… and again. Finally, on the second call, the cluster state will enter Stopping state, but will never go into Stopped state due to this failure.
Actual Fix
As a quick fix, we renewed webhook URL but for long term solutions, we will apply a finite-state machine to our cluster status change mechanism to not update a cluster status from Stopped to Stopping.