Our Journey to a High-Performance Node.js Library
As you may already know, the Hazelcast In-Memory Data Grid (IMDG) ecosystem includes a variety of clients for different languages and runtimes, which includes Node.js client library as a part of that list.
You can use Hazelcast clients in various cases, including, but not limited to the following:
- Building a multi-layer cache for your applications with IMap, a distributed, replicated key-value store, and its NearCache.
- Enabling pub-sub communication between application instances.
- Dealing with high load for views or likes events by using a conflict-free replicated counter.
- Preventing races when accessing 3rd-party services by using FencedLock and other distributed concurrency primitives available in Hazelcast CP Subsystem (powered by Raft consensus algorithm).
High performance and low latency for data access have always been a key feature of Hazelcast. So, it’s not surprising that we put a lot of time and effort into optimizing both server-side and client libraries.
Our Node.js library went through numerous performance analysis and optimization runs over the course of several releases, and we think it’s worth telling you the story and sharing the gathered experience. If you develop a library or an application for Node.js and performance is something you care about, you may find this blog post valuable.
TL;DR
- Performance analysis is not a one-time action but rather a (sometimes tiring) process.
- Node.js core and the ecosystem includes useful tools, like the built-in profiler, to help you with the analysis.
- Be prepared for the fact that you will have to throw many (if not most) of your experiments into the trash as part of the optimization process.
- While “high-performance library” title may sound too loud, we do our best to deserve it for Node.js and all the other Hazelcast client libraries.
We’re going to start this story in spring 2019, in the times of 0.10.0 version of the Node.js client. Back then, the library was more or less feature complete, but there was little understanding of its performance. Obviously, it was necessary to analyze the performance before the first non-0.x release of the client and that’s where this story starts.
Benchmarks
It’s not a big secret that benchmarking is tricky. Even VMs themselves may introduce noticeable variation in results and even fail to reach a steady performance state. Add Node.js, library, and benchmark code on top of that and the goal of reliable benchmarking will get even harder. Any performance analysis has to rely on inputs provided by some kind of benchmark. Luckily, version 0.10.0 of the library included a simple benchmark used in early development phases. That benchmark had some limitations which needed to be resolved before going any further.
The existing benchmark supported only a single scenario with randomly chosen operations. There is nothing wrong with having a random-based scenario in the benchmark suite, but only when more narrow scenarios are present in the suite. In the case of a client library, that would be “read-heavy” and “write-heavy” scenarios. The first assumes sending lots of read operations, thus moving the hot path to the I/O read-from-socket code and further data deserialization. You may have already guessed that the second scenario involves lots of writes and moves write-to-socket and serialization code to the hot path. So, we added these additional scenarios.
Another noticeable addition to scenarios was support for the payload size option. Variation in payload size is important when running benchmarks, as it helps with finding potential bottlenecks in the serialization code. Using different payload types is also valuable, but for a start, we decided to deal with strings only. String type is used for storing JSON data on the Hazelcast cluster, so our choice had a nice side-effect of testing a significant part of the hot path for JSON payload type (i.e., for plain JavaScript objects).
The second problem was self-throttling of the benchmark. Simply put, the benchmark itself was acting as a bottleneck hiding real bottleneck issues present in the client library. Each next operation run by the benchmark was scheduled with the setImmediate() function without any concurrency limit for the sent operations. Apart from becoming a bottleneck, this approach also created a significant level of noise (sometimes it’s called “jitter”) in the benchmark results. Even worse, such logic puts the benchmark very far from real-world Node.js applications.
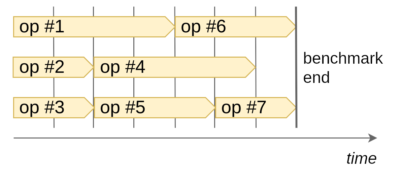
That’s why we improved the benchmark by enforcing the given concurrency limit. The end behavior of our benchmark runner is close to the popular p-limit package and can be visualized as the following diagram:

The diagram shows how operations are executed when the concurrency limit is set to 3 and the total count of operations to be run is 7. As a result, the load put on both the client and the server-side instances is evenly distributed, which helps to minimize the jitter.
Finally, we added a warm-up phase into the benchmark to give both client and server VMs some time to reach a steady state.
Now, with our new shiny benchmark, we were ready to start the actual analysis.
Here Come the Bottlenecks
The very first benchmark run showed the following results in scenarios based on IMap’s get() (“read-heavy”) and set() (“write-heavy”) operations.
| Scenario | get() 3B | get() 1KB | get() 100KB | set() 3B | set() 1KB | set() 100KB |
| Throughput (ops/sec) | 90,933 | 23,591 | 105 | 76,011 | 44,324 | 1,558 |
Each result here stands for an average throughput calculated over a number of benchmark runs. Result variation, median and outliers are omitted for the sake of brevity, but they were also considered when comparing results.
Data sizes (3B, 1KB, and 100KB) in the table stand for the value size. Of course, absolute numbers are not important here, as we didn’t yet have a baseline. Still, the results for the smallest value size look more or less solid and, if we would only run these benchmarks, we could stop the analysis, give the library a green light for the first major release, and arrange the release party. But results for larger values are much more disturbing. They scale down almost linearly with the growth of the value size, which doesn’t look good. This gave us a clue that there was a bottleneck somewhere on the hot path, presumably in the serialization code. Further analysis was required.
Node.js is quite mature and there are a number of tools in the ecosystem to help you with finding bottlenecks. The first one is the V8’s sampling profiler exposed by Node.js core. It collects information about call stacks in your application with a constant time interval and stores it in an intermediate profile file. Then it allows you to prepare a text report based on the profile. The core logic is simple: the more samples contain a function on the top of the call stack, the more time was spent in the function when profiling. Thus, potential bottlenecks are usually found among the most “heavy” functions.
Profiler reports are helpful in many situations, but sometimes you may want to start the analysis with visual information. Fortunately, flame graphs are there to help. There are a number of ways to collect flame graphs for Node.js applications, but we were more than fine with 0x library.
Here is a screenshot of the flame graph collected for the set() 3B scenario.
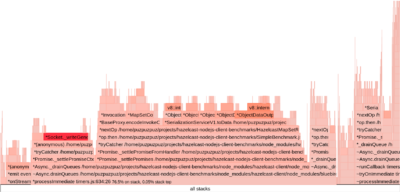
This screenshot is static, while 0x produces an interactive web page allowing you to zoom and filter through the contents of the flame graph. In this particular case, it took us some time to iterate over so-called “platos” in search of suspicious calls. Finally, we found a good candidate highlighted in the next picture.
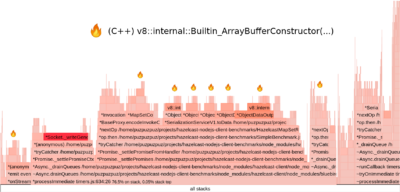
It appeared that the library was doing a lot of unnecessary allocations for Buffer objects. Buffers are low-level objects based on V8’s ArrayBuffer class, which represents contiguous arrays of binary data. The actual data is stored off-heap (there are some exceptions to this rule, but they are not relevant for our case), so allocating a Buffer may be a relatively expensive operation.
As a simple fix, we tried to get rid of certain Buffer allocations happening in the library by doing those allocations in a greedy manner. With this change, the benchmark showed us the following.
| get() 3B | get() 1KB | get() 100KB | set() 3B | set() 1KB | set() 100KB | |
| v0.10.0 | 90,933 | 23,591 | 105 | 76,011 | 44,324 | 1,558 |
| Candidate | 104,854 | 24,929 | 109 | 95,165 | 52,809 | 1,581 |
| +15% | +5% | +3% | +25% | +19% | +1% |
The improvement was noticeable for smaller payloads, but the scalability issue was still there. While the fix was very simple, if not primitive, the very first bottleneck was found. The fix was good enough as the initial optimization and further improvements were put into the backlog for future versions of the library.
The next step was to analyze so-called “read-heavy” scenarios. After a series of profiler runs and a thoughtful analysis, we found a suspicious call. The call is highlighted on the following screenshot for get() 100KB flame graph.
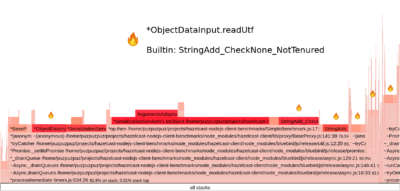
The ObjectDataInput.readUtf() method appeared to be executed on a significant percentage of collected profiler samples, so we started looking into that. The method was responsible for string deserialization (i.e., creating a string from the binary data) and looked more or less like the following TypeScript code.
private readUTF(pos?: number): string {
  const len = this.readInt(pos);
  // ...
  for (let i = 0; i < len; i++) {
    let charCode: number;
    leadingByte = this.readByte(readingIndex) & MASK_1BYTE;
    readingIndex = this.addOrUndefined(readingIndex, 1);
    const b = leadingByte & 0xFF;
    switch (b >> 4) {
      // ...
    }
    result += String.fromCharCode(charCode);
  }
  return result;
}
In general, the method was similar to what we had in the Hazelcast Java client. It was reading UTF-8 chars one by one and concatenating the result string. That looked like a suboptimal code, considering that Node.js provides the buf.toString() method as a part of the standard library. To compare these two implementations, we wrote simple microbenchmarks for both string deserialization and serialization. Here is a trimmed result for the serialization microbenchmark.
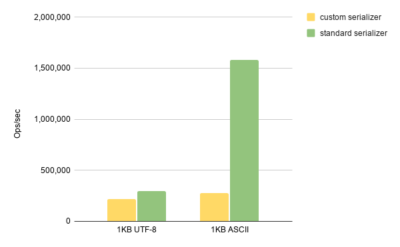
As it is clearly seen here, the standard API is significantly (around 6X) faster than our custom implementation when it comes to ASCII strings (which are a frequent case in user applications). Results for deserialization and other scenarios look similar with the respect to the string size correlation. That was the exact reason for the scalability issue.
The standard library is significantly faster in the ASCII string case, as V8 is smart enough to detect the case and go over the fast path where it simply copies string contents instead of decoding/encoding individual chars. For those of you who are curious about the corresponding V8 source code, here is the place responsible for the buf.toString()’s fast path.
Anyhow, before making the final verdict, it was necessary to confirm the hypothesis with a proper experiment. To do so, we implemented a fix and compared it with the baseline (v0.10.0).
| get() 3B | get() 1KB | get() 100KB | set() 3B | set() 1KB | set() 100KB | |
| v0.10.0 | 90,933 | 23,591 | 105 | 76,011 | 44,324 | 1,558 |
| Candidate | 122,458 | 104,090 | 7,052 | 110,083 | 73,618 | 8,428 |
| +34% | +341% | +6,616% | +45% | +66% | +440% |
Bingo! Lesson learned: always bet on the standard library. Even if it’s slower today, things may change dramatically in the future releases.
As a result of this short (~1.5 weeks) initial analysis, Hazelcast Node.js client v3.12 was released with both of the discussed performance improvements.
Now, when there is an understanding of our usual process, let’s speed up the narration and briefly describe optimizations shipped in later versions of the library.
Automated Pipelining
Protocol pipelining is a well-known technique used to improve the performance of blocking APIs. On the user level, it usually implies an explicit batching API, which is only applicable to a number of use cases, like ETL pipelines.
Obviously, the same approach can be applied to Node.js with its non-blocking APIs. But we wanted to apply the technique in an implicit fashion so that most applications would benefit from the new optimization. We ended up with the feature called automated pipelining. It can be illustrated with the following diagram.
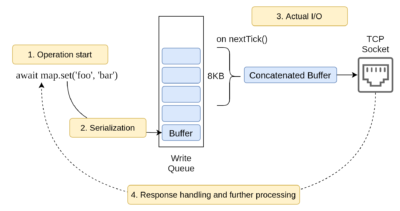
The main idea is to accumulate outbound messages based on the event loop lifecycle instead of writing them into a TCP socket immediately when the user starts an operation. The messages are scheduled to be concatenated into a single Buffer (with a configured size threshold) and only then are written into the socket. This way we benefit from batch writes without having to ask the user to deal with an explicit pipelining API.
Another important aspect here is that the client keeps one persistent connection per cluster member (note: we’re talking of smart client mode). Consequently, network communication over each connection is intensive enough to make the described batching logic valuable in terms of throughput.
Hazelcast Java client implements something close to this optimization by concatenating messages before writing them into the socket. A similar approach is used in other Node.js libraries, like DataStax Node.js driver for Apache Cassandra.
Benchmark measurements for automated pipelining showed 24-35% throughput improvement in read and write scenarios. The only drawback was a certain degradation (~23%) in scenarios with large message writes (100KB), which is expected considering the nature of the optimization. As real-world applications read data more frequently than write it, it was decided to enable automated pipelining by default and allow users to disable it via the client configuration.
Later on, we have improved automated pipelining by optimizing the code, which was manipulating the write queue. The main improvement came from reusing the outbound Buffer instead of allocating a new one on each write. Apart from this, we also were able to get rid of the remaining unnecessary Buffer allocations that we had in the library. As a result, we got around 8-10% throughput improvement. This latest version of automated pipelining may be found in the 4.0 release of the client.
Boomerang Backups
As you may guess, it’s not all about Node.js specific optimizations. Periodically, all Hazelcast clients get common optimizations. Client backup acknowledgments (a.k.a. boomerang backups) are a recent example of this process.
Previously, the client was waiting for the sync backups to complete on the member. This was causing 4 network hops to complete a client operation with sync backup. Since sync backup configuration is our out-of-the-box experience, boomerang backups optimization was introduced. The following diagram illustrates the change in terms of client-to-cluster communication.
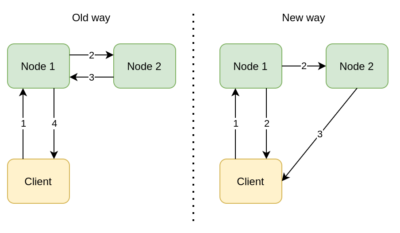
As it may be seen above, boomerang backups decrease network hops to 3. With this change, we saw up to 30% throughput improvement in our tests. This optimization was shipped in client v4.0.
Migration to Native Promises
Everyone knows that callbacks lost the battle and most Node.js applications are written with promises. That’s why Hazelcast Node.js client had a Promise-based API from the day one. In older versions, it was using the bluebird Promise library for performance reasons. But since then, V8’s native Promise implementation got much faster and we decided to give native promises a try.
Benchmark measurements showed no performance regression after the migration, so the switch was shipped in v4.0. As a nice side effect of this change, we got an out-of-the-box integration with async_hooks module.
Other Optimizations
Expectedly, there were a bunch of smaller optimizations done on the way. Say, to reduce the amount of litter generated on the hot path we switched from new Date() calls to Date.now(). Another example is the default serializer implementation for Buffer objects. It allows users to deal with Buffers instead of plain arrays of numbers. Not saying that the internal code responsible for manipulations with Buffers also improved a lot. It’s hard to notice an effect of individual optimization here, but they’re certainly worth it.
A Self-Check
Before the wrap-up, let’s try to look at what we achieved in about one year. To do so, we’re going to run a couple of benchmarks for versions 0.10.0 (our baseline) and 4.0 (the latest one).
For the sake of brevity we’re going to compare IMap.set() and get() operations for 1KB ASCII values. Hopefully, the payload is close enough to what one may see on average in Node.js applications. Here is how the result looks like.
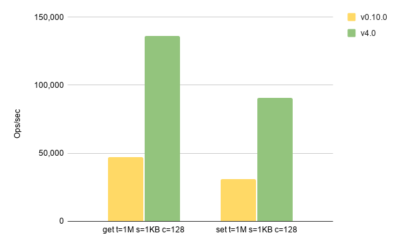
In the above chart, we see almost x3 throughput improvement in both operations. The value of all implemented optimizations should be obvious now.
What’s Next?
There are multiple things we want to give a try in both the library and the tooling. For instance, we’re experimenting with the onread option available in the net.Socket class. This option allows one to reuse Buffer when reading from the socket. Unfortunately, tls module used by the client for encrypted communication lacks the counterpart option, so recently we contributed to the Node.js core to improve things.
Our benchmarking approach also needs some improvements. First of all, we want to start considering operation latency by collecting latency data into an HDR histogram throughout benchmark execution. Another nice addition would be integration with Hazelcast Simulator, our distributed benchmarking framework. Finally, support for more data structures and payload types won’t hurt.
Lessons Learned
Yes, we know that the “high-performance library” title may be too loud, but we do our best to deserve it. For us, as open-source library maintainers, performance analysis is a process that requires constant attention. Necessary routing actions, like pre-release performance analysis, may be tiring. We had to throw many (if not most) of our experiments into the trash can. But in the end, performance is something we aim to deliver in all of our client libraries.


