
By Bence Eros
Software Engineer in Management Center team
Bence Erős is a senior developer in the Management Center team at Hazelcast. Bence has 10+ years of experience with the java platform, also is a long-time open-source enthusiast. He has a degree in software engineering from the University of Debrecen, Hungary.
View all blogs by the authorSep 3, 2020
Monitoring Hazelcast with Prometheus using Management Center 4.2020.8
From version 4.2020.08 of Hazelcast Management Center, it is possible to monitor Hazelcast clusters using Prometheus. This opens up a variety of monitoring and alerting capabilities. In this blog, we’ll go through some examples of configuring the Prometheus integration of Management Center and setting up graphs and alerts in Prometheus based on the Hazelcast metrics.
- The demo application that we want to monitor is a computation-focused IMDG application which receives integers (from a fake caller, for the sake of example), calculates the prime factors of the integer (the actual computation is off-loaded to a distributed IExecutorService) and stores the results in an IMap called “primeFactors”.
- The map is also warmed up on startup by calculating prime factors of random integers, which is received via an ITopic, used as a message queue. While the process is running, we will monitor the number of pending and completed executor tasks in Prometheus.
- The IMap has an underlying MapStore which persists all calculated prime factors in a file-backed MapDB map.
Given this application, we may want to visualize the following metrics:
- How many unprocessed messages are published to the topic
- What is the average execution time of the tasks run by the IExecutorService
- Number of pending and completed tasks
- Latency of put operations on the “primeFactors” map (what is the overhead of storing the results in MapDB)
Let’s see how to monitor these metrics with Prometheus.
Configuring Prometheus
Download Prometheus from https://prometheus.io/download, and extract the package. Then let’s add the following few lines to the scrape_configs section of prometheus.yml (in the Prometheus installation root directory):
scrape_configs:
  # ...
  - job_name: 'HZ MC'
    static_configs:
    - targets: ['localhost:8080']
This config tells Prometheus to query metrics from the http://localhost:8080/metrics which is the default port number of Management Center. Now you can start Prometheus with ./prometheus and access the Prometheus frontend from your browser at http://localhost:9090
Starting up Hazelcast Management Center
Let’s start up Hazelcast Management Center with the following command:
java -Dhazelcast.mc.prometheusExporter.enabled=true -jar hazelcast-management-center-{MC_VERSION}.jar
You can see that the Prometheus exporter feature of Management Center is disabled by default, and can be turned on using the hazelcast.mc.prometheusExporter.enabled system property on startup.
By default, Management Center exports all available metrics to Prometheus. This is fine for local testing and experimentation, but isn’t recommended for production installations since it can be quite overwhelming for Prometheus. Therefore it is strongly recommended to specify the metrics you are interested in using the hazelcast.mc.prometheusExporter.filter.metrics.included system property to filter the list of included metrics (which should be a comma-separated list of metric names):
java -Dhazelcast.mc.prometheusExporter.enabled=true \
-Dhazelcast.mc.prometheusExporter.filter.metrics.included=hz_topic_totalReceivedMessages,hz_topic_totalPublishes,hz_executor_totalExecutionTime,hz_executor_completed,hz_executor_pending,hz_map_totalPutLatency \
-jar hazelcast-management-center-{MC_VERSION}.jar
Building and starting the monitored application
Once you’ve cloned the demo application, you can build and run it with:
git clone
https://github.com/erosb/hz-mc-prometheus-demo.git
cd hz-mc-prometheus-demo
mvn clean package
java  -jar target/prometheusdemo-1.0-SNAPSHOT.jar
(note: running the process will quickly saturate all your CPU cores)
Visualizing the metrics with Prometheus
Now, if you navigate to http://localhost:9090 in your browser then you can enter the following PromQL queries into the query field, which will return the metrics we are interested in:
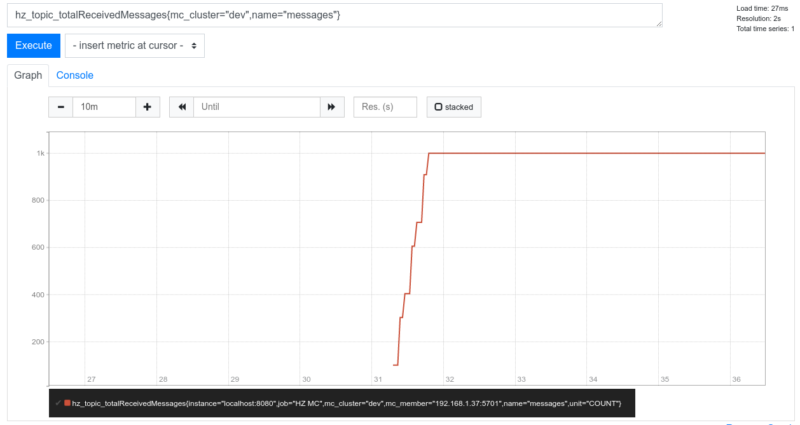
Number of messages received in the topic
PromQL query:
hz_topic_totalReceivedMessages{mc_cluster=”dev”,name="messages"}
Takeaways from this query:
- Hazelcast Management Center can be connected to multiple Hazelcast clusters. Since now we are interested in only one cluster, we filter the received metrics by the mc_cluster tag (“dev” is the default cluster name
- Every data structure-specific metric can be filtered by the name of the distributed object with the “name” tag
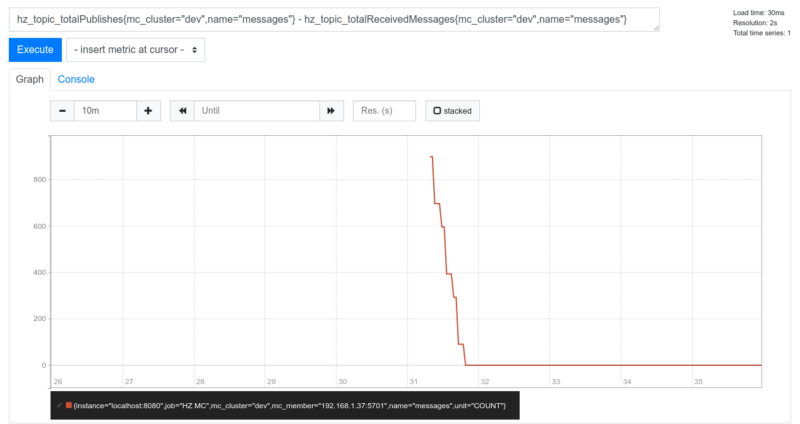
Number of unprocessed messages on the topic
PromQL query:
hz_topic_totalPublishes{mc_cluster="dev",name="messages"} - hz_topic_totalReceivedMessages{mc_cluster="dev",name="messages"}
Takeaways from this query:
- PromQL supports basic arithmetic operations, so here we can get the number of unprocessed messages by subtracting the received message count from the total number of published messages
- Keep proper filtering by tags in mind, just like in the previous example
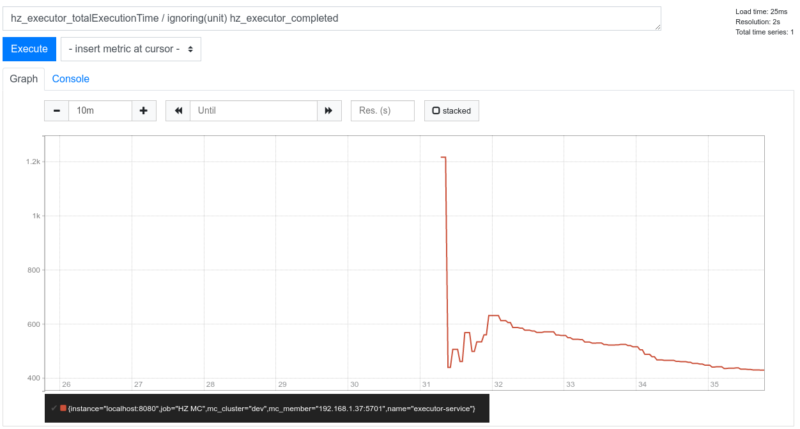
Average execution times of prime factorization tasks
PromQL query:
hz_executor_totalExecutionTime / ignoring(unit) hz_executor_completed
Takeaways from this query:
- When performing arithmetic expressions on vectors (time series) the actual numeric values are paired from the two source vectors in a strict way: if any of the metric tags have different values, then it should be explicitly ignored. See one-to-one vector matching for details in the PromQL documentation.
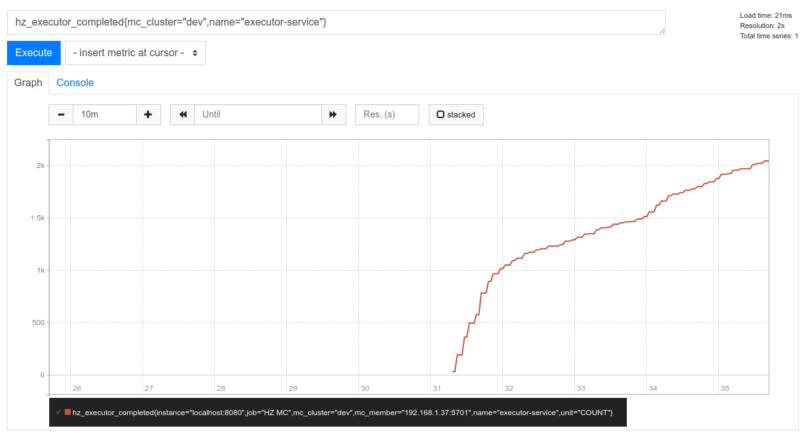
Completed task count
PromQL query:
hz_executor_completed{mc_cluster="dev",name="executor-service"}
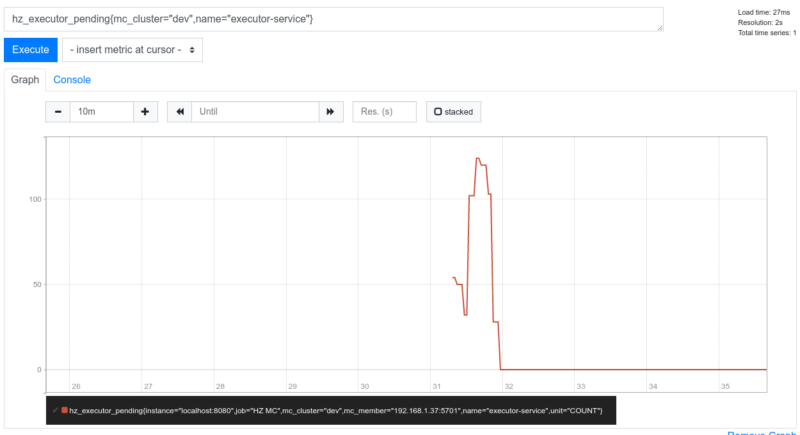
Pending task count
PromQL query:
hz_executor_pending{mc_cluster="dev",name="executor-service"}
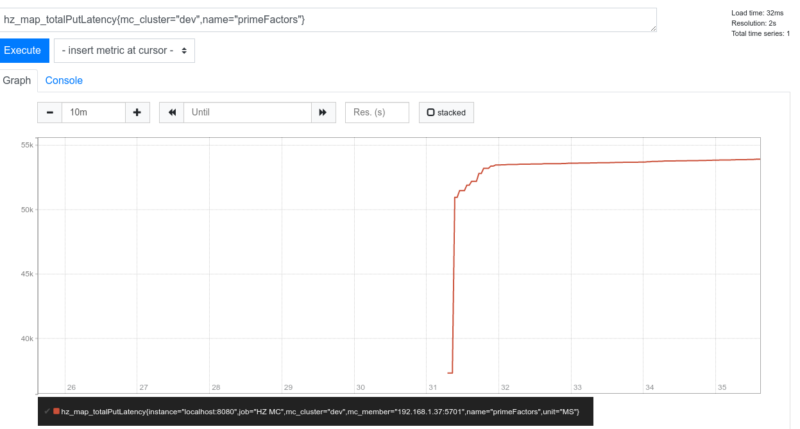
Map put latency
PromQL query:
hz_map_totalPutLatency{mc_cluster="dev",name="primeFactors"}
Conclusion
In this post, we introduced the Prometheus exporter capabilities of Management Center 4.2020.8 with a couple of examples. For further documentation please refer to the Prometheus Exporter section of the Management Center documentation.