
Apr 9, 2025
Turbocharging Java Reflection Performance with MethodHandle
Reflection in Java is a powerful feature that allows introspection and manipulation of the application at runtime. However, it comes with a well-known drawback: performance overhead:
“Reflection involves types that are dynamically resolved, certain Java virtual machine optimizations can not be performed. Consequently, reflective operations have slower performance than their non-reflective counterparts”
Developers often accept this cost as unavoidable, but what if there was a way to mitigate it?
In this blog post, we’ll explore how we investigated and optimized reflection performance, specifically in the context of Hazelcast metrics collection. We’ll cover:
- The problem and context – how Hazelcast uses reflection in metrics gathering
- Investigation and benchmarking – measuring the impact of using reflection
- Key takeaways and next steps– how these findings were applied in Hazelcast
Read on if you’ve ever wondered whether you can improve the efficiency of your Java applications’ reflection.
Problem and Context
To support monitoring, Hazelcast Platform can collect metrics to be supplied to various consumers, which is implemented internally by annotating the field or method that reports the metric and then using reflection to collect all those values.
For methods, this lookup was implemented by finding the annotated methods and simply invoke-ing them:
Long result = (Long) method.invoke(source);
return result.longValue();
This approach works fine – but can we do better?
Investigation and Benchmarking
Let’s put some numbers together with a JMH benchmark, comparing our simple reflective method call versus a direct method call to quantify the overhead.
mvn clean install jmh:benchmark
-Djmh.benchmarks=benchmark.PrimitiveReflectiveAccessBenchmark
|
Access Type |
Execution Time |
|---|---|
|
Direct |
0.5 |
|
Simple Reflective Call |
6.5 |
So, we’ve quantified in this (synthetic) example that reflection is over 10x slower.
MethodHandles are (as the name suggests) a directly invocable reference to a method and offer improved performance by moving some accessibility checks from being evaluated when the method is invoked to when the MethodHandle is created. By keeping a reference to the MethodHandle we can do these checks just once rather than every time it’s invoked, as with our original reflective implementation.
First, let’s swap our use of simple Java reflection with MethodHandles.
Obtaining the MethodHandle:
Method method = source.getClass().getDeclaredMethod("longMethod");
MethodHandle methodHandle = MethodHandles.lookup().unreflect(method);
And then invoke-ing the same method as before:
Long result = (Long) methodHandle.invoke(source);
return result.longValue();
Re-running our benchmarks:
|
Access Type |
Execution Time |
|
Direct |
0.5 |
|
Simple Reflective Call |
6.5 |
|
MethodHandle invoke |
4.1 |
Now we see a significant improvement – over 50% faster.
However, performance isn’t just runtime – we also need to consider memory allocation. Although the method return is a primitive long, both our reflective operations are getting a boxed Long object and then having to unbox it to get the long primitive we actually want.
Luckily, JMH can measure this, too:
mvn clean install jmh:benchmark
-Djmh.benchmarks=benchmark.PrimitiveReflectiveAccessBenchmark
-Djmh.prof=gc
|
Access Type |
Execution Time |
Object Allocations |
|
Direct |
0.5 |
0 |
|
Simple Reflective Call |
6.5 |
24 |
|
MethodHandle invoke |
4.1 |
24 |
Now we can see that these extra Object allocations are significant – each reference must be managed and garbage collected.
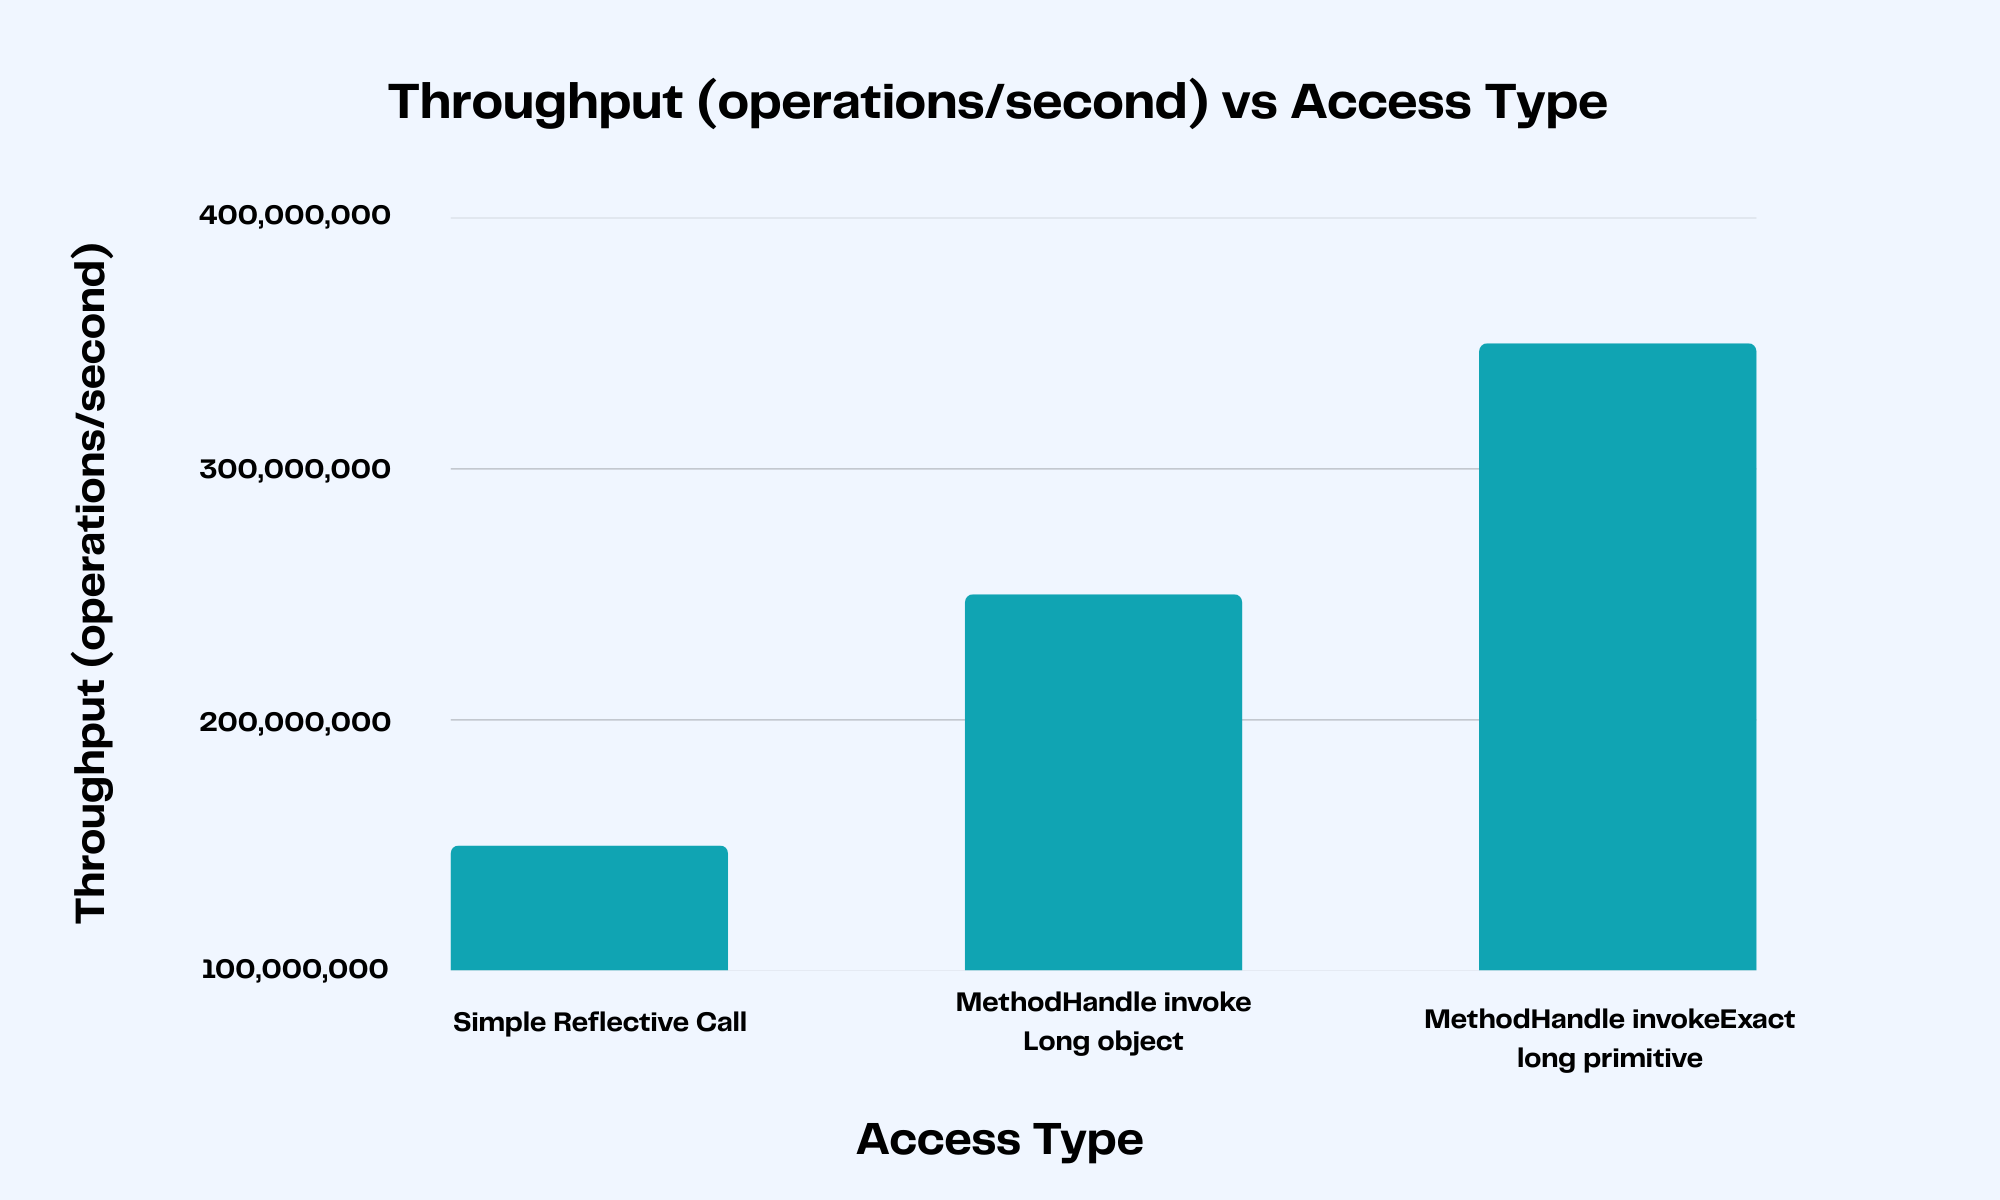
To address this, we can use a special behavior of MethodHandle: signature polymorphism.
This allows us to invoke the MethodHandle, specifying the return type (by inference) even for primitive values:
return (long) methodHandle.invokeExact(source);
This looks pretty similar, but when we benchmark…
|
Access Type |
Execution Time |
Object Allocations |
|
Direct |
0.5 |
0 |
|
Simple Reflective Call |
6.5 |
24 |
|
MethodHandle Invoke Long object |
4.1 |
24 |
|
MethodHandle invokeExact Long primitive |
2.7 |
0 |
Now, we can see a significant difference – over twice as fast as reflection and orders of magnitude more efficient regarding object allocations.
Again, a JMH benchmark is created to compare the different access options.
mvn clean install jmh:benchmark
-Djmh.benchmarks=benchmark.ReferenceReflectiveAccessBenchmark
|
Access Type |
Execution Time |
|
Direct |
2.1 |
|
Simple Reflective Call |
6.0 |
|
MethodHandle |
3.6 |
As before, MethodHandle is offering increased performance – but we can use these in conjunction with LambdaMetafactory to do even better.
Using LambdaMetafactory, we can optimize further by directly binding the target of the MethodHandle into a lambda Function, avoiding any reflective access altogether at runtime.
MethodHandles.Lookup lookup = MethodHandles.lookup();

// The accessor method we want to access
Method method = source.getClass().getDeclaredMethod("getLong");

MethodHandle methodHandle = lookup.unreflect(method);

// The type we want to bind our accessor to
MethodType factoryType = MethodType.methodType(Function.class);
// The expected return type of the accessor and the class the accessor is contained within
MethodType interfaceMethodType = MethodType.methodType(Long.class, source.getClass());

// A reference to the accessor via the Function intermediary
CallSite callSite = LambdaMetafactory.metafactory(lookup, "apply", factoryType, interfaceMethodType, methodHandle, methodHandle.type());

// The resultant Function that's now bound to the accessor
Function<SomeSource, Long> lambdaMetafactoryFunction = (Function<SomeSource, Long>) callSite.getTarget().invoke();
This dynamically generates a lambda equivalent to:
Function<SomeSource, Long> myFunction = new Function<SomeSource, Long>() {
    @Override
    public Long apply(SomeSource someSource) {
        return someSource.getLong();
    }
};
|
Access Type |
Execution Time |
|
Direct |
2.2 |
|
Simple Reflective Call |
6.0 |
|
MethodHandle |
3.6 |
|
LambdaMetafactory |
2.2 |
Again, we are seeing a significant performance improvement – matching direct access speeds but accessing dynamically at runtime.

Key Takeaways and Next Steps
Our investigation demonstrates that the perceived performance cost of Java reflection isn’t insurmountable. By strategically replacing standard reflection calls with MethodHandles and LambdaMetafactory, we achieved significant performance improvements, even matching direct access speeds in some cases.
Key takeaways from this investigation include:
- MethodHandle and LambdaMetafactory Offer Real Gains: These APIs provide powerful mechanisms to optimize reflective operations, reducing overhead associated with dynamic lookups and enabling JVM optimizations. invokeExact proved particularly effective for primitive types by avoiding boxing/unboxing costs.
- Benchmarking is Crucial: Quantifying performance differences using tools like JMH was essential to identify bottlenecks and validate the effectiveness of our optimizations.
- Real-World Impact: These optimizations weren’t just theoretical; they were successfully integrated into Hazelcast 5.4, enhancing the efficiency of its metrics collection system.
For Java developers grappling with reflection-related performance bottlenecks, adopting MethodHandle and LambdaMetafactory presents a viable path toward more efficient and responsive applications. Careful benchmarking is key to realizing these gains in your specific context.
Want to explore further? Check out the benchmarks and Hazelcast Implementation.