
Principal Architect
With over 30 years of industry experience, Neil has designed, developed, debugged, and supported software systems for numerous customers large and small. Initially, a C and assembler programmer, most of the last 20 years have been Java-based, with a focus on distributed systems, data grids, and stream processing. Neil is an occasional committer to the Hazelcast code base, with special interest on GoLang.
View all blogs by the authorJul 18, 2018
Session Analysis for an Online Shop
In this example. we’ll look at doing some analytics on an online shop to gain insights into customer behaviour.
Background
Most online shops follow a similar pattern in terms of the customer experience.
Users are presented with a catalogue of products on a browser page or mobile application, and may make selections from these. Items selected are added to a virtual shopping basket.
At some stage in the process there is the chance to manipulate the contents of the virtual shopping basket, removing items, changing the quantities for items, or other amendments such as colour or size changes for clothing.
Once the user has finished with their deliberations, there is a checkout stage where the order is committed, payment is taken and various other activities happen such as arranging for the delivery of the items, confirmation emails and so on.
Analytics
As a retailer, we would be interested in understanding this behaviour, and this is where the analytics come in.
With a better understanding of what customers do we can adjust the shopping experience to better suit the customer, increasing customer retention, revisits and so on for a long term profitable business.
The Problem – “Cross-Sells”
The problem we’re looking at here is known as “cross-sells”, where the purchase of one item leads to the purchase of another item.
For example, the customer might add a torch to their virtual basket. A sensible thing to buy as well might be batteries. If that’s something the customer needs and they buy from us, that’s convenience for the customer and more sales for us, everyone wins.
Note also the reverse inference is not so certain. If the customer is buying batteries, it’s much more of a guess that they need a torch too. They might already have bought a torch (from us!) or it might be they need batteries for a TV remote control, lots of possibilities.
So the problem really is about sequencing and causality. What things do people buy together that may be related.
Winter Clothing
Torches and batteries are too obvious. To make things interesting our online shop will sell hats, gloves and scarves.
What we’d like to know is what do most people do.
Does a selection of a scarf usually result in the extra selection of a hat ? Or is a scarf selection more usually followed by gloves ?
De-selections might be interesting to know about too. If a scarf, then a hat and then gloves are selected, how often is the scarf de-selected (removed from the basket prior to purchase).
To do all of this, we want to track the history of the user’s virtual basket.
The code
The code for this example is structured as follows, and should be build using mvn install.
├── common/ ├── server/ ├── client/ ├── pom.xml ├── README.md
Once build, you should run one instance of the server and one of the client modules, using the commands:
java -jar server/target/server-0.1-SNAPSHOT.jar
and then
java -jar client/target/client-0.1-SNAPSHOT.jar
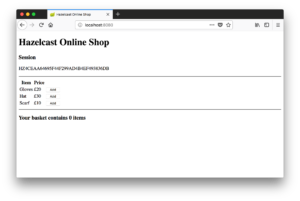
Step 1: client interaction The client module here is a JVM that is a client of the Hazelcast cluster, but also runs an embedded Tomcat server on port 8080.
If you navigate on your browser to localhost:8080 you should something similar to the below:

This clearly isn’t the world’s best online shop, but that’s not what this example is about. You can click on the add buttons, and if the basket isn’t empty go the checkout.
For simplicity, there’s not a page to display the basket content nor a way to remove items from the basket. And the checkout page doesn’t take any money, not ideal for the real world!
Follow Along The actual steps accompanying these screenshots are as follows. You can do these too, or vary it, though obviously the latter will give different analysis results.
- Gloves, Hat, Scarf, checkout
- Gloves, checkout
- Gloves, Scarf, checkout
- Gloves, Hat, checkout
- Hat, Scarf, checkout
- Scarf, Hat, checkout
Session Id
Note that the page displays an HTTP session id, in this case HZ3230C826F6744BB595C7F95A6F4F3EDE. The value changes each time we checkout. It’s not normally something shown to the end user, but it’s useful for following what’s happening. You’ll also see this listed in the JVM logs on both the client and server JVM logs.
This HTTP session id is the key of the session object when stored in the “jsessionid” map.
Step 2: data analysis The server process has a command-line interface provided by [Spring Shell][1].
Two commands here do interesting things, LIST and ANALYSIS.
These commands are in upper case to distinguish them from the pre-defined ones such as help and quit.
LIST From the command line, type the command LIST into the server process. You may need to press enter a few times to see the command prompt, logging of other activity may have cluttered the screen.
Console output from the first list command
There is are Hazelcast maps called “jsessionid”, “sequence” and “stock”. These are listed along with their content.
The “stock” map displays the stock that the client shows on screen.
The “jsessionid” map displays any active HTTP sessions for browser windows.
The “sequence” map displays the output of data analysis.
ANALYSIS Now give the analysis command to the server process’s command line to run the data analytics.
Console output from the analysis command
Analysis is not meant to be interactive. You might see console output that indicates something is happening, but not any results show.
Step 3: Results! From the server process, give the LIST command to the command line processor.
Now the “sequence” map should have some content, as this is where the ANALYSIS command stores the results.
Console output from the second list command
Exactly what sequences of basket manipulation you have recorded will depend on what buttons you clicked in step 1.
Follow Along – Results
If you chose to follow along, your result should be
IMap: 'sequence' -> 'Tuple2{3, Scarf}' -> 1 -> 'Tuple2{2, Scarf}' -> 2 -> 'Tuple2{1, Gloves}' -> 4 -> 'Tuple2{1, Scarf}' -> 1 -> 'Tuple2{1, Hat}' -> 1 -> 'Tuple2{2, Hat}' -> 3 [6 entries]
The Tuple2 (pair) that begin with 2 represent the 2nd thing added to the basket.
Of these, we have
-> 'Tuple2{2, Scarf}' -> 2
-> 'Tuple2{2, Hat}' -> 3
Scarf has a count of 2 and hat has a count of 3. Hat is a more frequent additional purchase than scarf, and gloves don’t feature at all as an additional purchase.
So, how is this done? Two things drive the analytics, a map event journal and a Jet processing job.
Map journal In the server module, look at the Hazelcast configuration file src/main/resources/hazelcast.xml.
This has a section:
<event -journal enabled="true"> <mapname>jsessionid</mapname> <capacity>10000</capacity> </event> An "event journal" is being automatically maintained for the Hazelcast map named "jsessionid".
This is a new feature that was added in Hazelcast IMDG 3.9. Each time an entry in that map is changed, a record of the changed is saved into an internal memory buffer. This buffer has a capacity of course. Here is it 10,000 items, so when then 10,001st record is saved the 1st is discarded. Actually it’s a ringbuffer.
As for the existing map listener events, these journal entries have access to the value before the change and the value after for each change event. The before value is null if the event was data creation. The after value is null if the event was data deletion.
This event journal differs from map listener events in two significant ways.
1 Map listener events are produced but not saved. With the map journal, and it’s JCache equivalent cache journal, you have access to the saved events and can see what has already happened.
2 Events recorded are series so can be grouped. Normal map listener events are singletons, are useful for observing how a field has changed from A to B, but not so convenient to observe a field changing from A to B to C.
The analysis The analysis uses a six step Jet calculation job, in com.hazelcast.samples.session.analysis.SequenceAnalysis.
In common with most Jet jobs, simple logical steps are easiest to understand, and best performance comes from discarding unneeded data early on.
Step 1 Step 1 reads from journal of changes attached to the “jsessionid” map, so is able to see how each HTTP session has changed over time.
Step 2 Step 2 applies a filter to step one. We are only interested in changes to the basket, so can ignore session creation when the basket will be empty, and session destruction when the customer has given up or the customer has decided to buy.
This could be combined into step 1, but we do it separately for clarity.
Essentially this step removes records, less data for the next stage. It is a selection.
Step 3 Step 3 applies some reformatting. HTTP sessions contain information such as the session id, last update time and so on that don’t concern us for this application. We are only interested in the basket so extract this.
Step 3, like step 2, could be combined into step 1. It is separate for clarity.
This step simplifies the data, there are the same number of records for the next stage but they are not as big. It is a projection.
Step 4 Step 4 is another filter. We are interested in basket changes, so discard all HTTP session changes where no new types of basket items have happened.
This means we include updates where a first scarf is added, and exclude updates where a second or mroe scarf is added. We are interested in the items selected, not their quantities.
Step 5 Step 5 looks at the change to the basket, and determines the ordinal of the added item.
For instance, gloves may have been the 3rd item added, so the output data record would be “(3, gloves)”.
Step 6 Step 6 takes the output from step 5 and uses it to update running totals in a map called “sequence”.
So if the “sequence” map has a key-value pair data record “(3, gloves) , 4” this means that gloves being added for the 3rd time has happened on 4 occasions.
These running totals are our analytics.
Exensions – 1 – Segmentation This example is based around a high-level. We’re looking for trends for which item is typically the first thing added to the basket, and which is typically second.
If you look closely in the code, here you’ll see that we are also capturing the so-called “user-agent” HTTP header.
The “user-agent” is a field that the browser sends as part of the HTTP request to indicate which kind of browser it is.
You might see "Mozilla/5.0 (Macintosh; Intel Mac OS X 10.13; rv:57.0) Gecko/20100101 Firefox/57.0" for Firefox or "Mozilla/5.0 (Macintosh; Intel Mac OS X 10_13_2) AppleWebKit/604.4.7 (KHTML, like Gecko) Version/11.0.2 Safari/604.4.7" for Safari and so on. It’s not 100% reliable, the browser may accidentally or deliberately send the wrong information.
Regardless we could extend the data analysis to subdivide behaviour by the browser, and understand customers better.
We might find that Internet Explorer users choose hats first, whereas Chrome users go for scarves.
This is a very real possibility. Various surveys have aligned different age groups as using differing browsers, and it doesn’t seem unreasonable to assume that shopping preferences for winter clothes could differ too. Older people may care more for warmth than fashion, or may have more savings to spend.
Extensions – 2 – Abandonments This example is looking at the update history for the basket. It doesn’t pay any attention to whether the basket was purchased, or if the customer gave up.
In the latter case, the HTTP session map is configured with a time-to-live of 60 seconds, so if the customer gives up likely what will happen is the session will expiry and be removed automatically by Hazelcast.
It wouldn’t be difficult to split the analysis into those sessions resulting in a purchase and those where the customer gives up, to see if there is any singificant differnce.
For example, if the last item added is also the dearest, does that make an abandonment more likely or less likely ?
Note also that the LIST command is making read access to the maps. This won’t have side-effects for expiry of the HTTP sessions, as the map here is configured for time-to-live which is write access.
Extensions – 3 – Session Grouping To keep the example simple, session update matching is implicit. It is assumed that two consecutive updates in the event history are for the same session. This is the case if there is only one user at a time, as is here with the follow-along style.
This is open to enhancement by the reader, and requires the HTTP Session Id (the object key) to be passed further through the processing pipeline.
A simple implementation would just be to discard “before” and “after” pairings with different HTTP Session Ids. This is easy coding, and if the online shop doesn’t have a huge number of concurrent customers will still get insights most of the time.
A more complex implementation would be use Jet’s “session windowing” and “grouping” functionality to collate and sort session updates by HTTP Session Id. This would complicate the processing more than intended for this blog post, but may feature in a later one.
Summary IMDG’s map journal introduced in Hazelcast 3.9 keeps a configurable history of changes. This doesn’t replace the existing map eventing system, but is a better choice for situations that need o look at non-consecutive changes or go back prior to the current point in time.
Jet can do simple or complex processing on such a stream of history.
Running such analysis on HTTP sessions allows meaningful insights to be obtained into shopping habits that can be input into designed better or more profitable e-commerce.
There are other ways to determine what is popular in an online shop, such as to look at the orders and stock levels. What tracking the basket does is give insights into the sequence things are selected, or de-selected.