Directed Acyclic Graph (DAG)
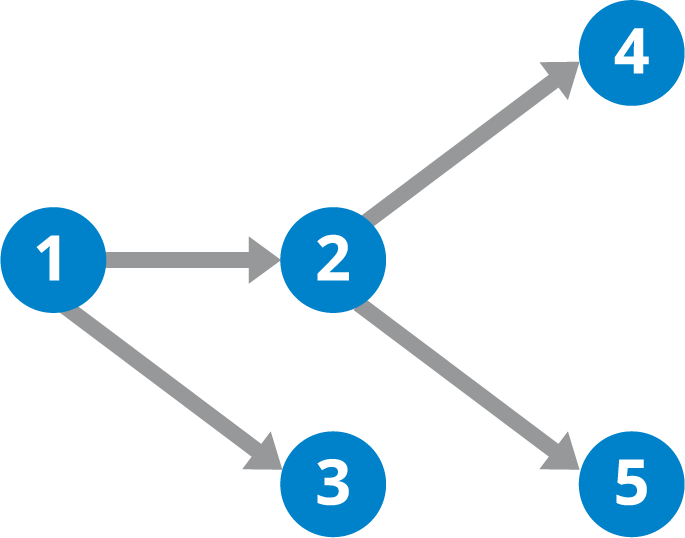
A directed acyclic graph (DAG) is a conceptual representation of a series of activities. The order of the activities is depicted by a graph, which is visually presented as a set of circles, each representing an activity, some of which are connected by lines, representing the flow from one activity to another. Each circle is known as a “vertex,” and each line is known as an “edge.” “Directed” means that each edge has a defined direction, so each edge necessarily represents a single directional flow from one vertex to another. “Acyclic” means that there are no loops (i.e., “cycles”) in the graph, so that for any given vertex if you follow an edge that connects that vertex to another, there is no path in the graph to get back to that initial vertex.
Why Are Directed Acyclic Graphs Useful?
DAGs help represent many different types of flows, including data processing flows. By thinking about large-scale processing flows in terms of DAGs, one can more clearly organize the various steps and the associated order for these jobs. In many data processing environments, a series of computations are run on the data to prepare it for one or more ultimate destinations. This data processing flow type is often called a data pipeline. As an example, sales transaction data might be processed immediately to prepare it for making real-time recommendations to consumers. As part of the processing lifecycle, the data can go through many steps, including cleansing (correcting incorrect/invalid data), aggregation (calculating summaries), enrichment (identifying relationships with other relevant data), and transformation (writing the data into a new format).
Characteristics of DAGs in Stream Processing
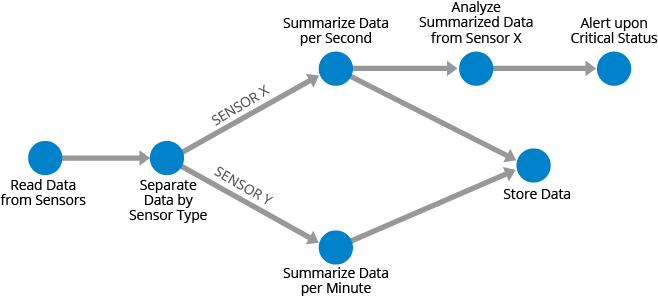
One key characteristic of DAGs and the data processing flows that they model is that there can be multiple paths in the flow. This is important because it recognizes the need to process data in multiple ways to accommodate different outputs and needs. In the example flow below, a stream of sensor data is processed. The streaming data is first loaded from the sensors and then separated by the sensor type. Sensor X data will be summarized per second and then analyzed in real-time. If any critical status is observed, an alert is sent. The data is also saved for long-term storage and possibly other analysis. Also in this flow is data from sensor Y, which for now is summarized per minute and then stored in the same long-term store as the data for sensor X.
DAGs in Batch Processing
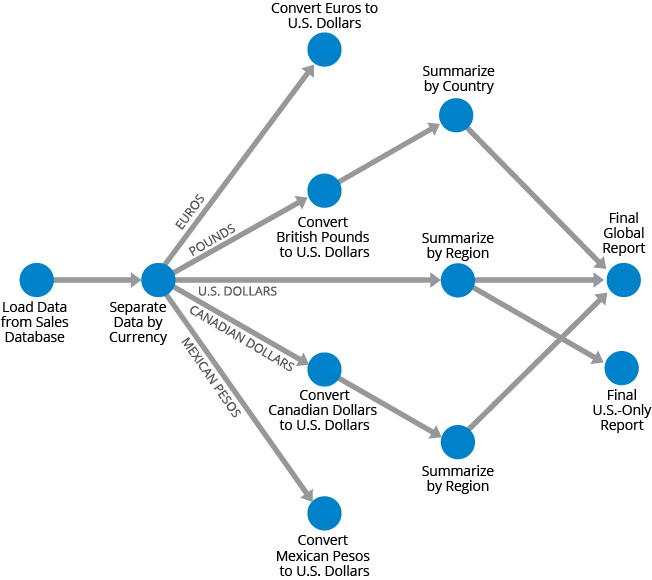
To give an example of how DAGs apply to batch processing pipelines, suppose you have a database of global sales, and you want a report of all sales by region, expressed in U.S. dollars. You might first load all data into a processing engine, separate out data by the different currencies, convert the financial figures to U.S. dollars, summarize the data by country/region, and then bring all the data together into a final report. And let’s say that the U.S.-only data will also be created into a separate report. This data flow could be represented by the DAG shown below.
Since DAGs apply to both batch and stream processing, it is increasingly common to have hybrid data processing environments that handle both stream and batch data sets. Technologies such as Hazelcast Platform, designed to handle both types of data, let companies build architectures that take advantage of all their data.